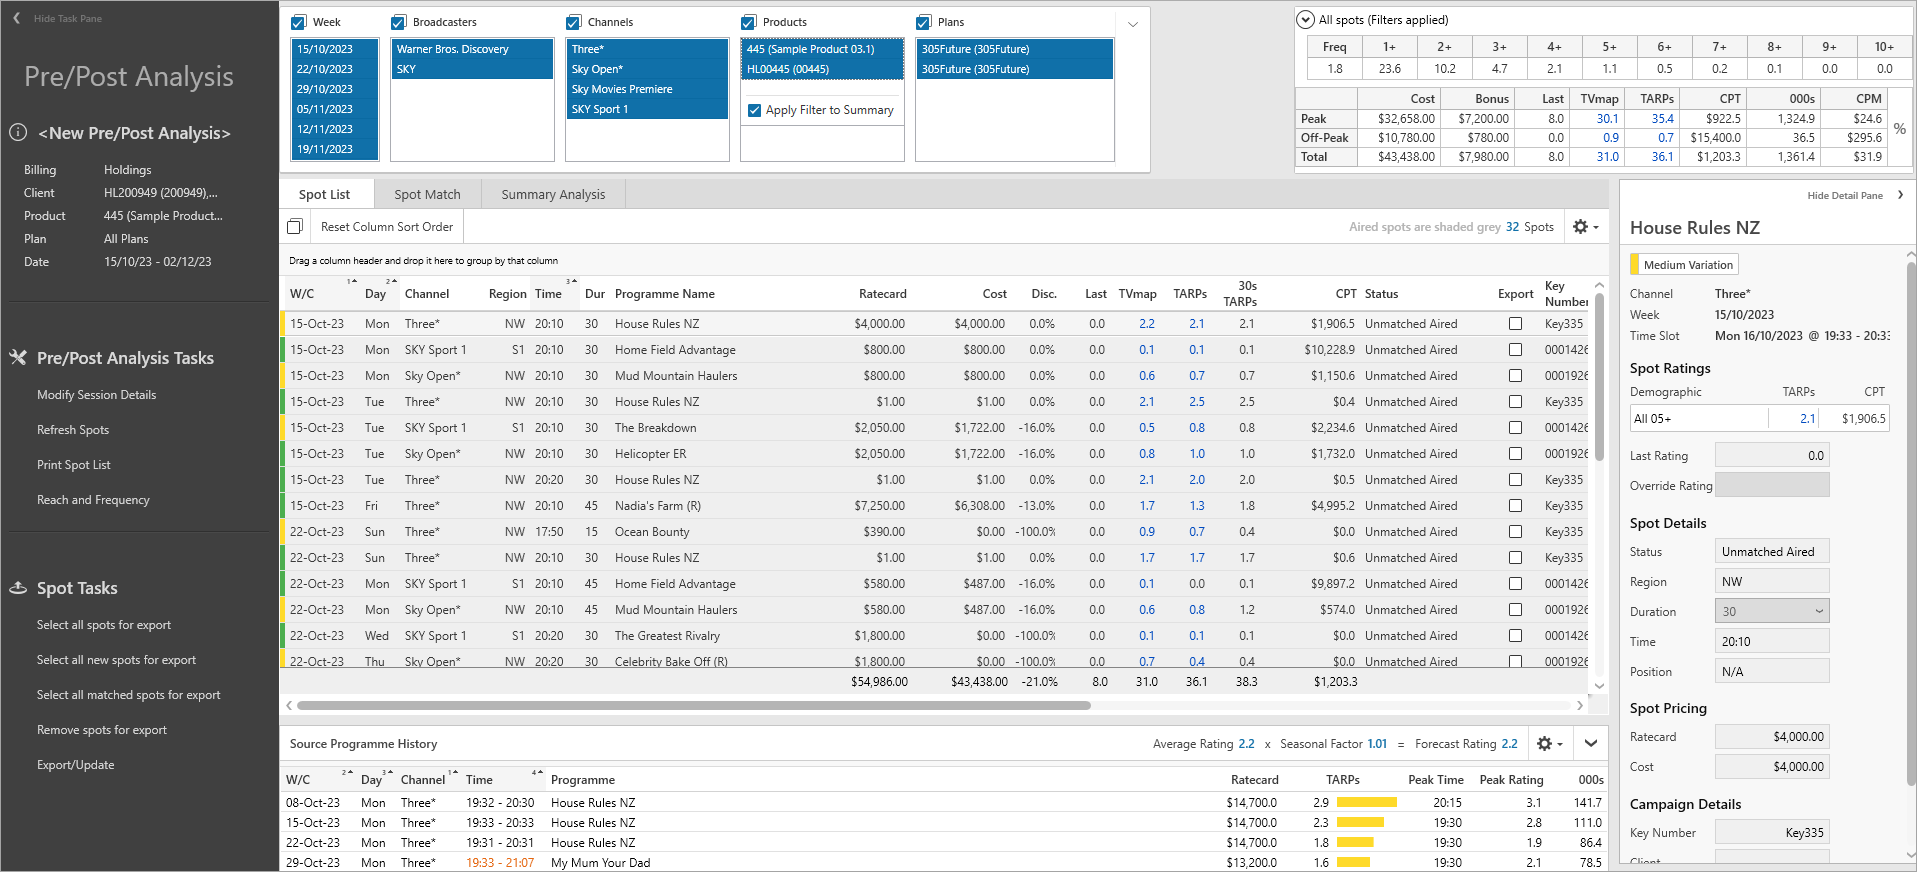
Once the session details have loaded, the Pre/Post Analysis screen will be displayed.
This shows the spot list, rating information and source week rating history based on parameters entered in the previous screen.
The demographic can be changed at any time and the ratings will automatically recalculate.
Task Pane
The Task Pane can be found on the left hand side of the Pre/Post Analysis screen.
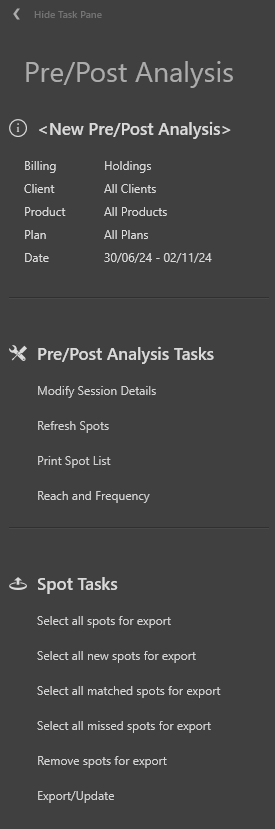
Session Details
Shows details of the current Pre/Post Analysis session including the Client, Product, Plan and Date Range selected
Pre/Post Analysis Tasks
Modify Session Details - this will open the Pre/Post Analysis Session Details screen to change/update the session details.
Refresh Spots - this checks information held in the Billing System and returns any new or additional spot information using the current session details.
Print Spotlist - to print or export current session. For more information see Print Spotlist.
Reach and Frequency - for more information see Reach and Frequency.
Spot Update
These options are available to assist with exporting updated spot information back to the billing system. This can be used after performing Spot Matching or after entering in overrides.
Select all spots for export - selects all spots for export to the billing system
Select new spots for export - only spots that appear to be new Holdings are selected. TVmap treats any spots that do not have a "last" estimate to be new.
Select all matched spots for export - selects all spots for export to the billing system that have been matched through Spot Matching.
Select all missed spots for export - select all missed spots for export to the billing system.
Remove spots for export - deselects any spots that had been selected for export.
Export/Update - sends updated spot information for selected spots back to the billing system.
Cumulative Frequency Distribution
This shows a summary of Cumulative Frequency Distribution (CFD) for the Pre/Post Analysis.
![]()
A full R&F can be obtained using the R&F icon from the toolbar.
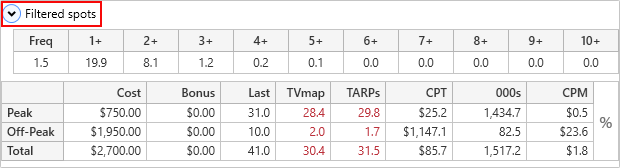
Campaign Accumulator
This table auto updates based off the primary demographic, to give a summary of Cost, Bonus, Last, TVmap, TARPs, CPT, 000s and CPM split by Peak and Off-Peak for the Pre/Post ssession.
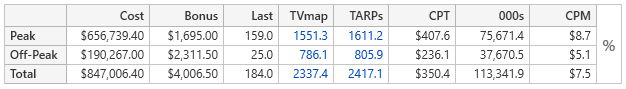
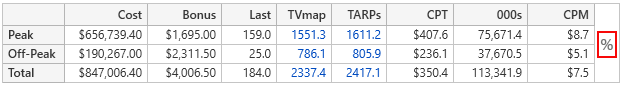
To toggle between actual values and percentage values click on the icon at the side.
TARPs that are 3% above or below the Last column will be colour coded. If it's largely unchanged it will remain grey.
•Red - value is lower than Last column value
•Blue - value is higher than Last column value
Quickly see Filtered Spots (totals exclude filtered or hidden spots) or All Spots (totals will include filtered and hidden spots) by changing the drop down option.
Session Selection Filters
Week Commencing, Broadcaster, Channels, Product and Plan filters are available and are populated based on the Pre/Post Analysis session parameters entered and spot information from the billing system.
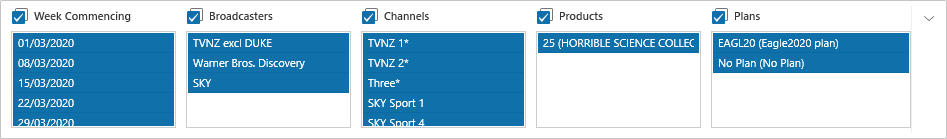
Filter by one or multiple options within each box or click Select All for all available options.
Select the expand icon to expand the window and change the filter options.

Apply Filter to Summary will be selected by default.
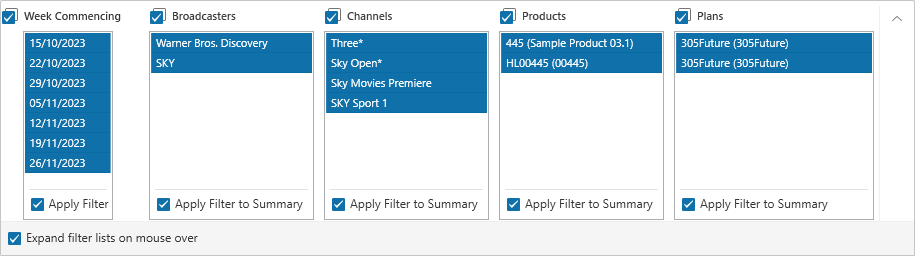
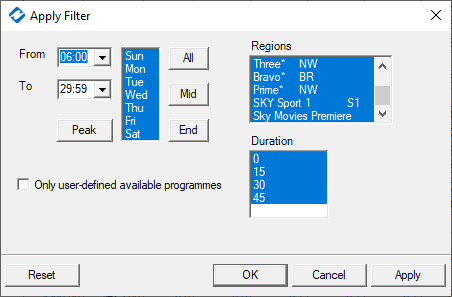
Can also use the Filter option from the toolbar to filter spots.
![]()
Spot List
The spot list displays all spots based on the Pre/Post Analysis Session Details.
Spots that have been to air will display actual TARPs in the TARPs column based on the booked time (until Spot Matching has been performed) and the row will be greyed out.
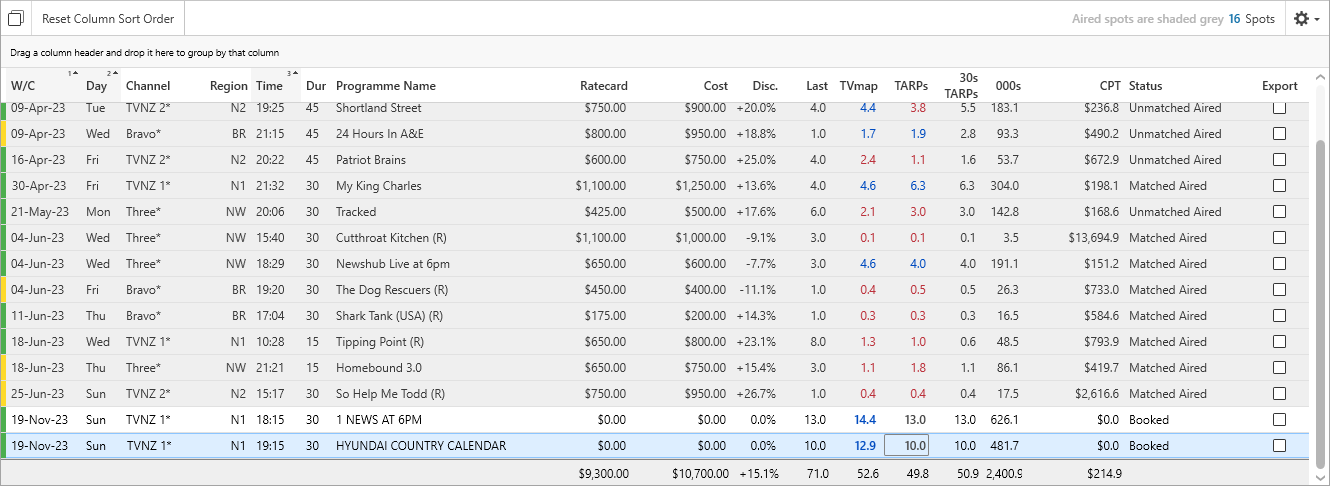
There are a number of columns within the Spot List that assist with analysing a campaign:
Programme Name - spots that have been to air will show the actual programme name. For spots in the future the programme name stored in the billing system will be shown.
Ratecard - cost as per ratecard.
Cost - actual cost of the spot.
Last - the last TARP estimate retrieved from the billing system.
TVmap - the average rating based on the source weeks selected - this value is seasonally adjusted.
TARPs - spots that have been to air will show the actual rating achieved for the booked quarter hour. The actual rating is from the booked time which may differ from the actual time the spot played. Future spots will display the LAST value unless it is 0, in this case the TVmap estimated rating will be used. TARP overrides can be entered and will be displayed in the Last column when exported back to the billing system.
30s TARPs - shows the 30 second equivalent.
CPT - cost per TARP based on the Act/Ovr column rating.
Key Number - the Agency key number for the spot.
Status - spots that have not been matched will show as Unmatched. Spots in the future will show as Booked and spots that have been through spot matching will show as MatchedAired. Filler spots appear after spot matching when a spot has been to air but was not matched to a billed spot.
Client/Creditor Code - the code from the billing system.
Priority Code - the priority code for the spot from the billing system.
Broadcaster Key Number - the Broadcaster key number for the spot.
Position in Break - the position in break as reported by the Broadcaster.
These are normally numbered to show the position of the spot in the break.
Schedule Payments will typically have ZZ as the position in break as these are not real spots.
For clarification on what the number represents please contact the Broadcaster.
Source Programme History Grid
When a spot is selected, the Source Programme History grid at the bottom of the screen will show information based on the source weeks that were selected when the Pre/Post session was opened/saved.
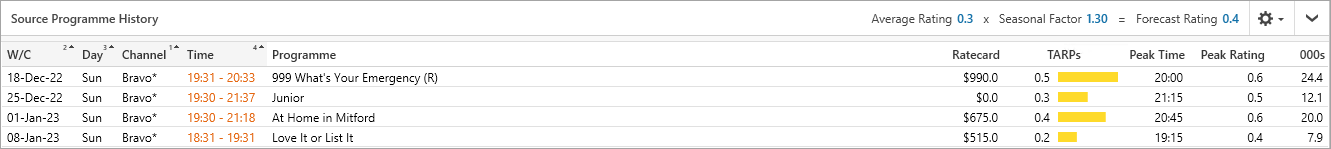
The Source Programme History details the cost, TARPs, peak time, peak rating, and 000s for the time zone of the selected spot. This appears in a graph format under the TARP column for the selected source weeks.
Source programming is important in determining how accurate rating predictions will be. In general, if the source programme information is stable, this will result in the most accurate predictions. If the source programme information shows large variations or special event programmes, manually overriding the rating predications should be considered.
To highlight source week variation, the rating column is coloured to indicate the level of variation.
Green = low variation
Yellow = moderate variation
Orange = high variation
Manual override of ratings can be carried out by simply overriding the TARPs column with your own estimated rating. Overridden ratings will show in the Last column after being exported back to the billing system. For more information on overriding TARPs click here.
Have more questions? E-mail us: support@broadcastmap.co.nz or call us: +64 9 304 0762
|
|
©2026 Broadcast M.A.P. Limited. All Rights Reserved.
|