________________________________________________________________________________
Contents
How are predicted ratings calculated in TVmap Analysis?
What is the difference in the way predicted ratings are calculated in other TVmap modules?
How do I run an Analysis for Prime-MW?
How do I add Discounts to see Rates/CPTs Nett of Discount?
How do I change week format to an actual date?
How do I paste the Analysis graph into Power Point?
How to analyse combined Broadcaster CPT adjustments Year on Year?
How do I use an Index to see how a campaign went against different demos?
What does 'Min value cannot be greater the Max' mean?
What does 'Problem calculating analysis results' mean?
________________________________________________________________________________
How are predicted ratings calculated in TVmap Analysis?
When analysing large time ranges individual programme performance is less critical so TVmap ignores the effects of individual programmes. TVmap calculates an average rating for timeslots based on the last 13 weeks for share and PUTs.
This can be adjusted under Advanced Settings within the Analysis Options.
•TVmap calculates a seasonal adjustment based on the source timeslot ratings vs the target programme ratings over many years to provide a smoothed estimate of seasonality (Typical range 0.8 – 1.2).
•TVmap applies seasonal adjustments to the average rating to create a predicted rating.
What is the difference in the way predicted ratings are calculated in other TVmap modules?
Buying, Campaign Manager and Pre/Post Analysis
Individual programme performance is important. TVmap predicts based on the selected source weeks (default is last four weeks).
Why use source weeks?
•To determine the closest corresponding programme in each of the source weeks
•Average the rating for the source programmes.
•Use of colour coding to indicate variance within the source weeks to assist with determining whether manual adjustment is required, see Source Programme History for more information.
•Calculate a seasonal adjustment based on the source programme ratings vs the target programme ratings over many years to provide a smooted prediction of seasonallity (typical range 0.8 – 1.2)
•Apply seasonal adjustment to the average to produce a predicted rating
Also see: How are the TVmap ratings in Buying calculated?
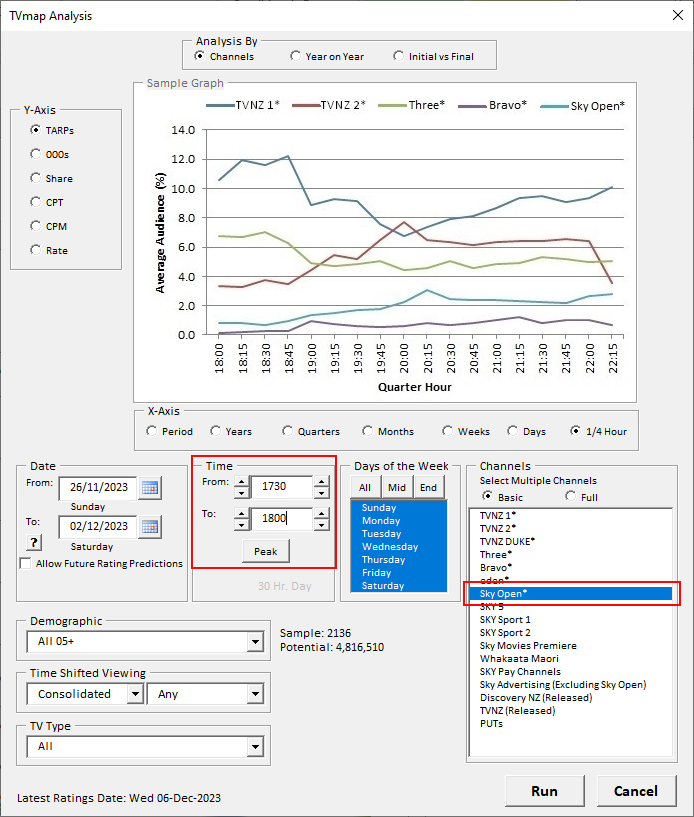
How do I run an Analysis for Sky Open-MW*?
Sky Open-WBD* is not available to select as a single station in Analysis.
In order to run an Analysis for Sky Open-WBD* select Sky Open* as the channel and limit the time range to 1700-1730
How do I add Discounts to see Rates/CPTs Nett of Discount?
Easiest way to get this information is to run Analysis then add in columns to calculate the discounted values.
Run an Analysis for CPT or Rate.
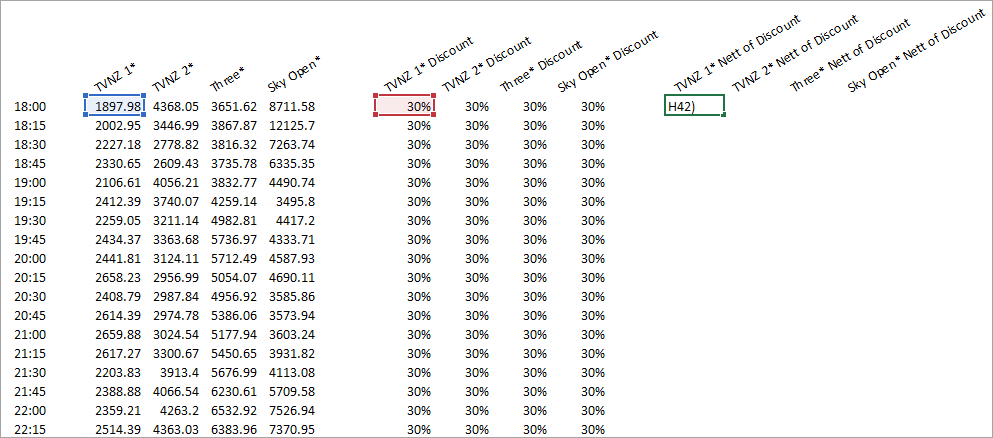
To the right of the results add in extra columns for each station which will be used for the discount and the calculation to get the nett of discount.
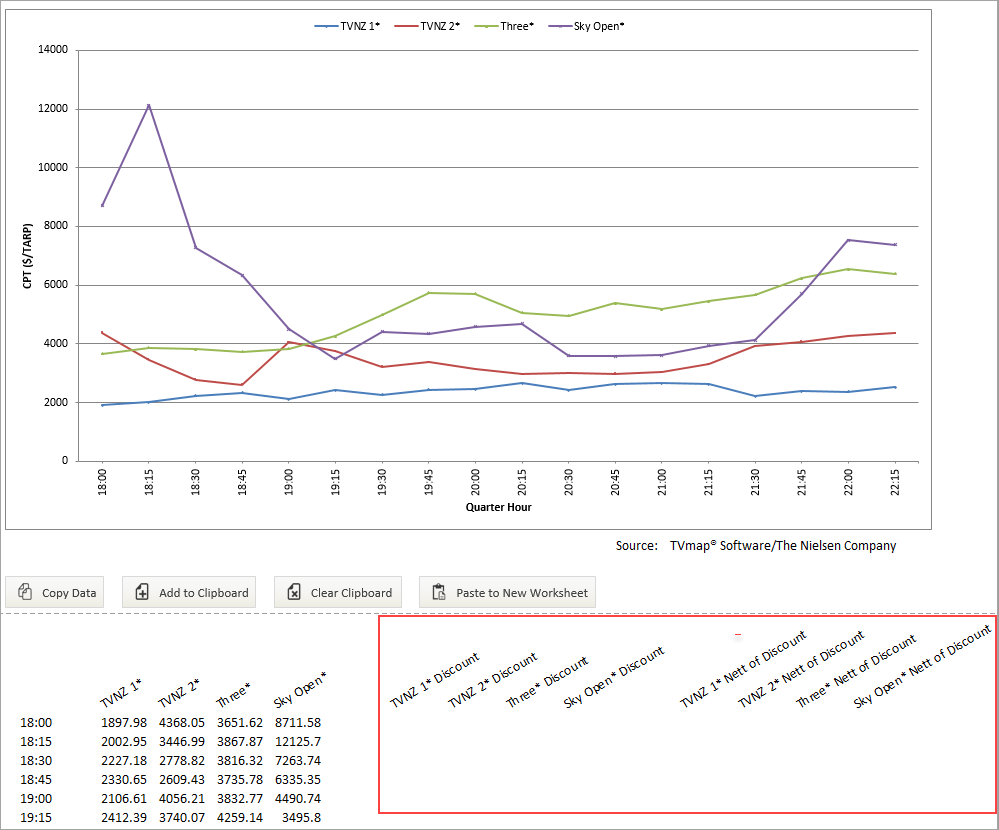
Enter the discount - make sure to use a % sign.
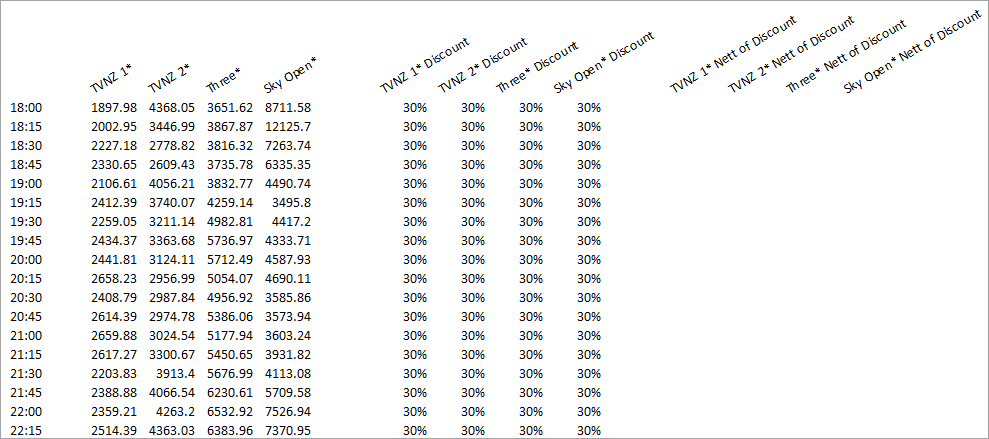
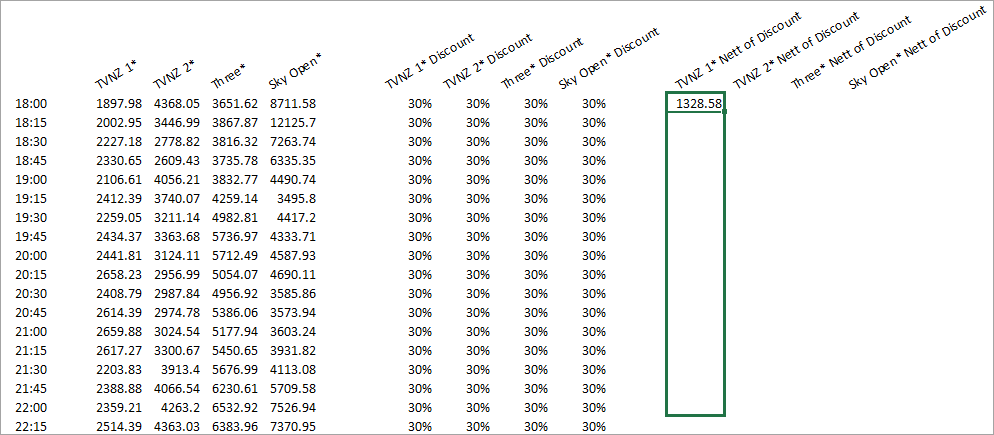
To calculate the Nett of Discount use the following formula =C42*(1-X42) with X being the column number of the first cell in the Discount section added earlier.
In this example it was H42.
Simply drag the calculation down then across to fill out the other cells.
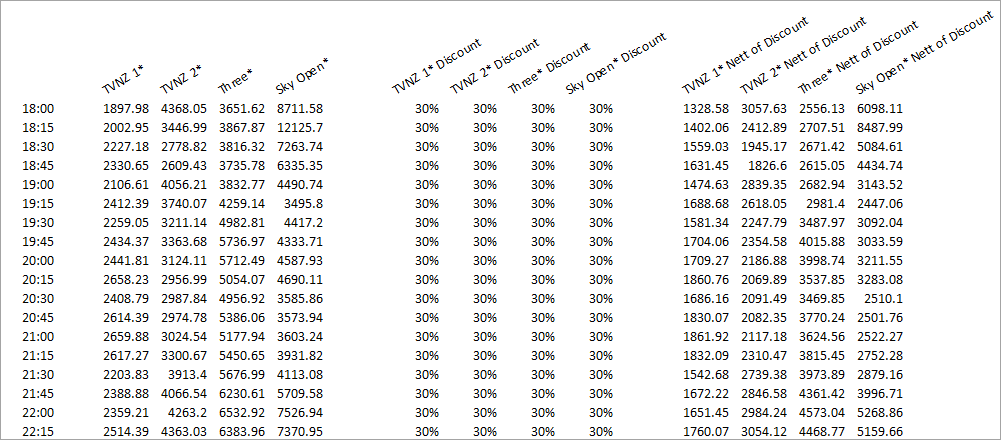
Note - You can copy the values back into the original cells to update the graph.
If you run analysis again it removes all of the calculated cells and replaces them with the new analysis run.
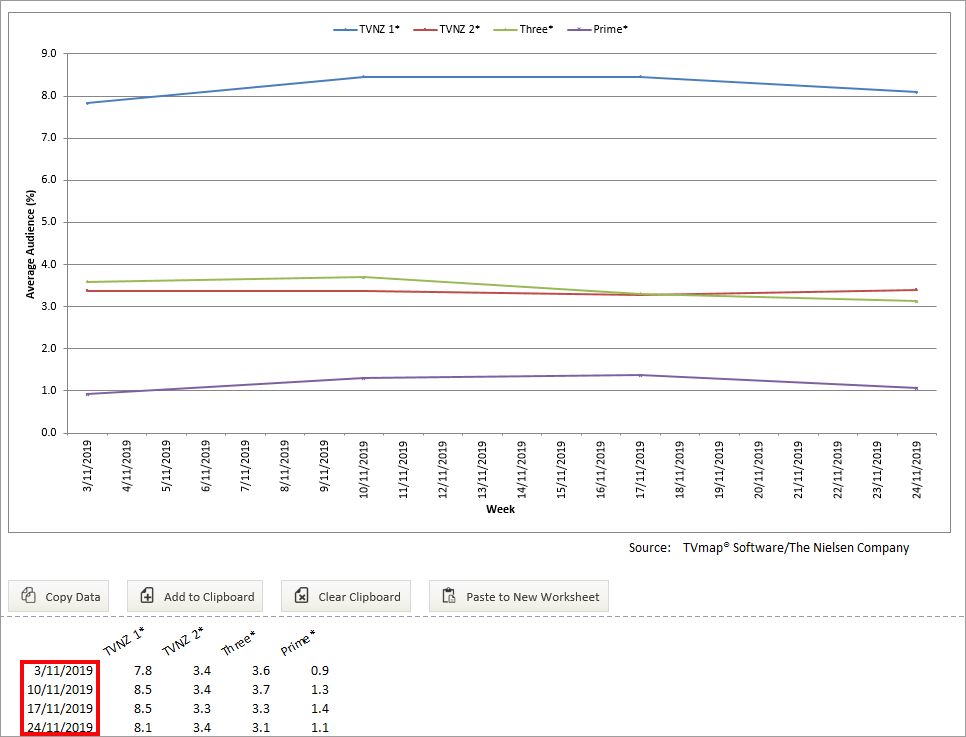
How do I change week format to an actual date?
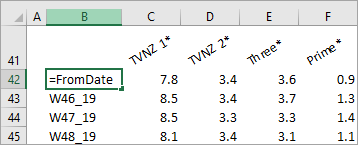
To change the week format to an actual date go to cell B42
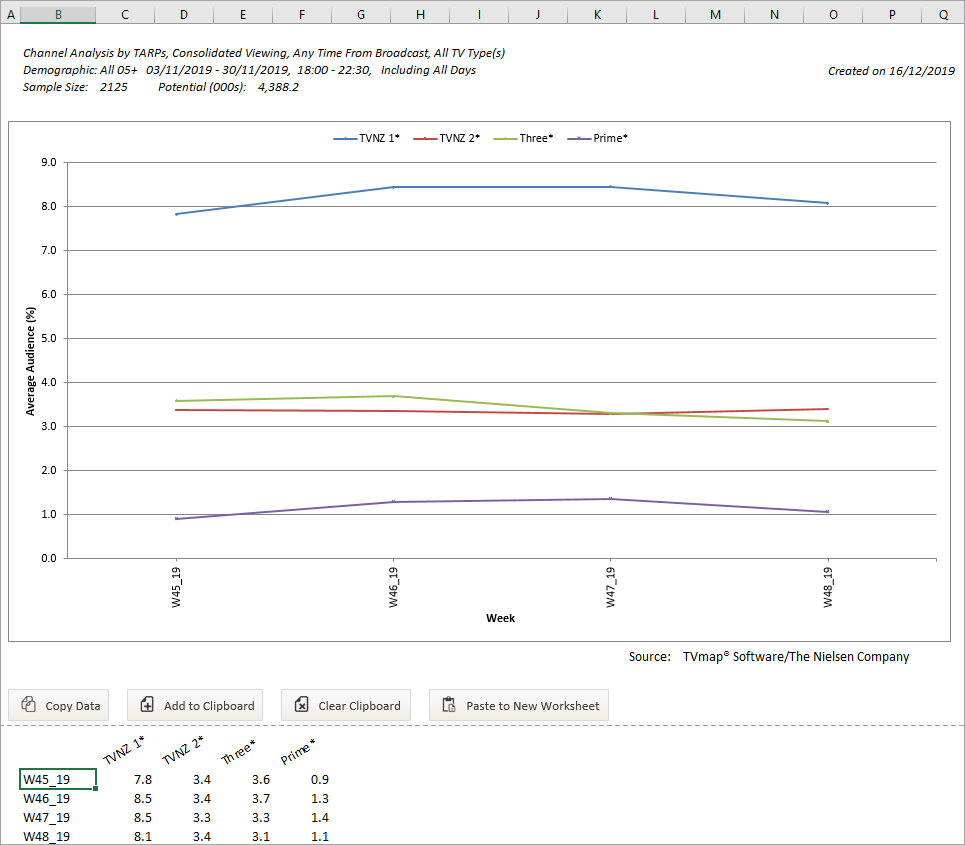
Enter the following formula =FromDate which will put the start date in the field
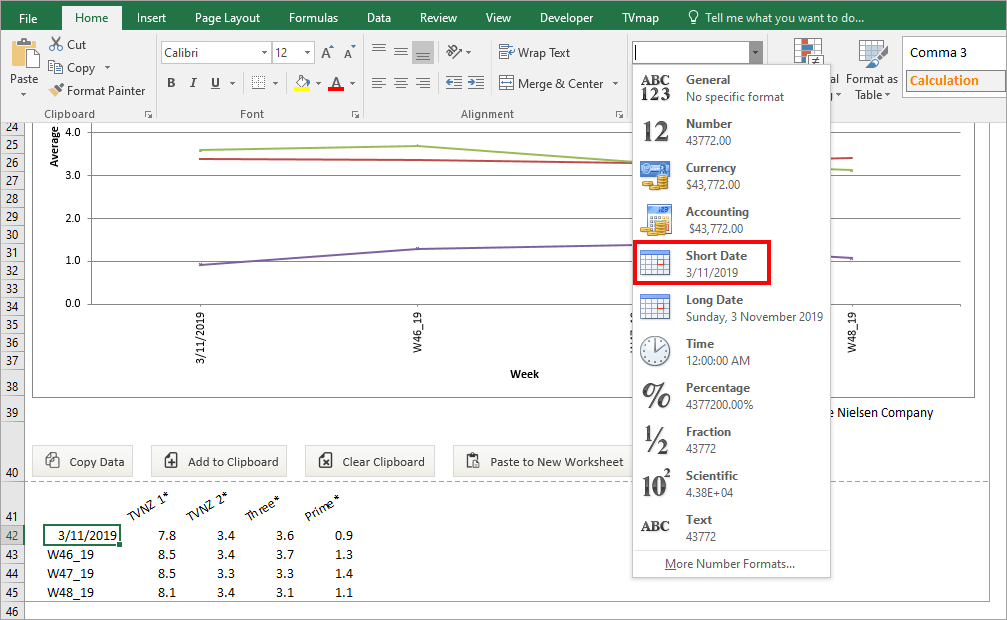
Change the format to Short Date which will now display a proper date format
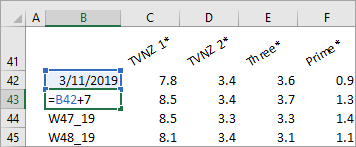
In cell B43 enter the following formula =B42+7
This will update the date so it increments by a week each time
Copy this formula into the remaining cells
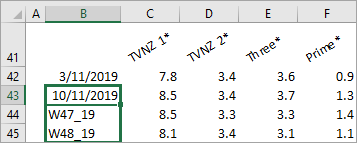
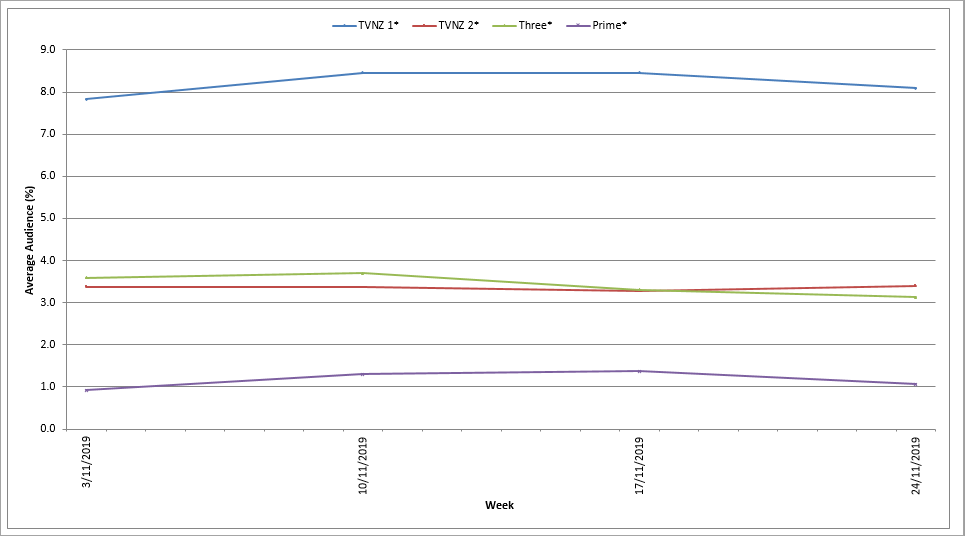
Weeks now appear in short date format
This change will cause the weeks on the axis to display for each day rather than just the week
To change this back to displaying week only, double click on the week axis
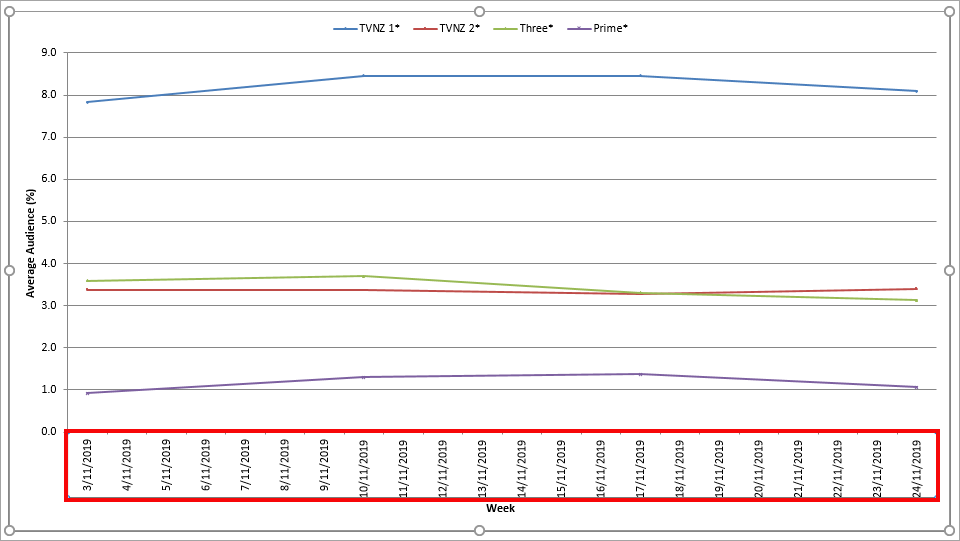
This will open the format axis options
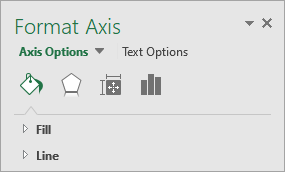
Select the graph icon and expand Axis Options
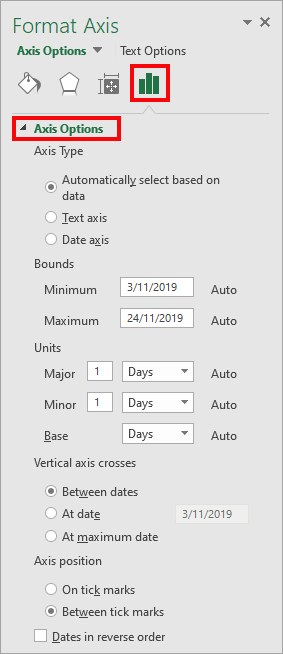
Check Date Axis and under Units change Major to 7
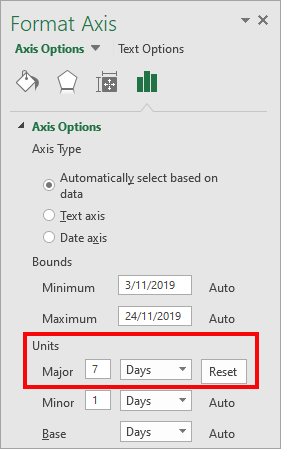
Date axis changes back to show week only in short date format
 +
+
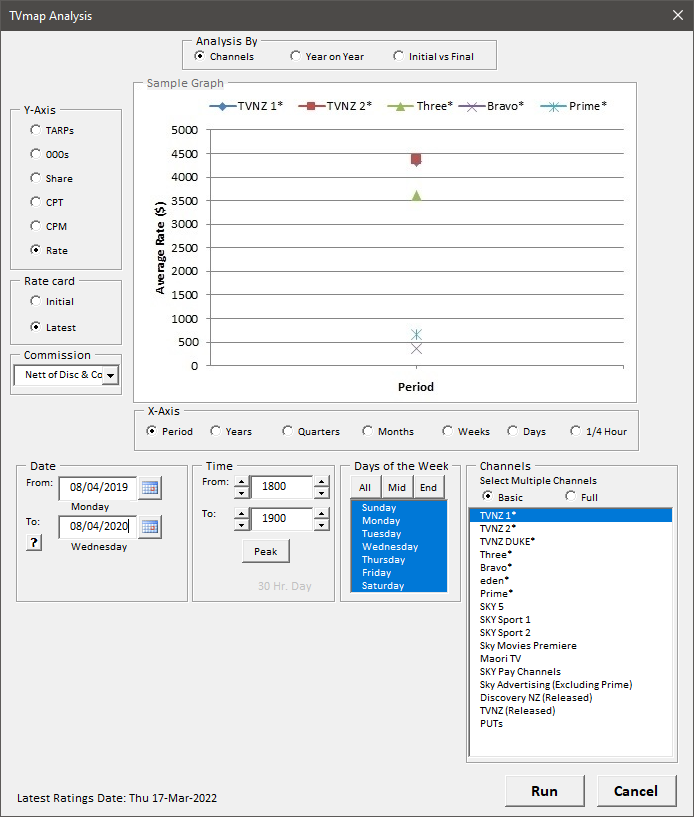
How to work out average rate for a single programme across a year
For a programme that is on at a consistent time all days of the week for example 1 News, then you can use Analysis to get this information.
If you want to average information for programmes where the times are not consistent use Programme Search instead.
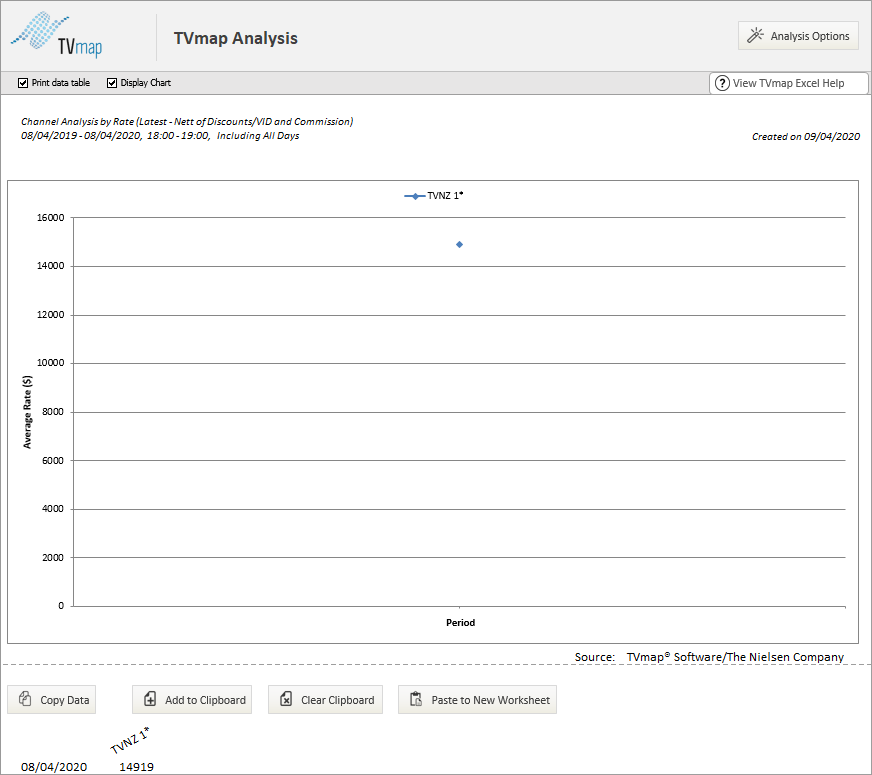
How do I paste the Analysis graph into Power Point?
If you are unable to copy and paste graph in Analysis into PowerPoint then you can export the sheet to a static worksheet and copy and paste from that into PowerPoint.
How to analyse combined Broadcaster CPT adjustments Year on Year
In Analysis you can not calculate a CPT by Broadcaster directly as the rate is stored per channel and not at the broadcaster level.
To calculate a Broadcaster CPT, use the CPT for each of the channels and use a weighted average to determine your overall % change.
i.e.
TVNZ 1 has a CPT increase of 25% from the previous year.
TVNZ 2 has a CPT increase of 50% from the previous year.
The formula for calculating the overall change = ( Channel 1 CPT % * Channel 1 % + Channel 2CPT % * Channel 2 %)
If you have a 50/50 split by Channel then the TVNZ CPT will increase by 37.5%. ( 25% * 50% + 50% * 50%) = .125 + .25 = 37.5
If you have an 80/20 split then the TVNZ CPT will increase by 45%. ( 25% * 20% + 50% * 80%) = 0.05 + 0.40 = 45%
If you have 100% being placed with TVNZ 2 then the combined TVNZ CPT will increase by 50%. (25% * 0% + 50% * 100%) = (0+0.5) = 50%
How do I use an Index to see how a campaign went against different demos?
For example:
A campaign booked against the demo All 25-54 delivers a total of 1261 ratings - this figure will be the base for the index.
Run the same campaign against the All 18-24 demo to get the total ratings - 1317
Divide the second demo ratings against the first demo ratings (which is the base)
1317 / 1261 = 1.0444 - then multiply by 100
1.0444 * 100 = 104 - this is the index.
104 means that this campaign was received by the second demo better than the first.
This is usually done against a number of different demos to gather the index.
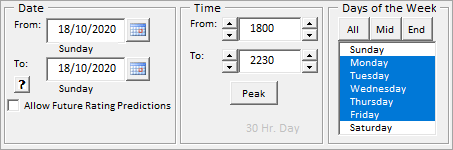
What does 'Min value cannot be greater the Max' mean?
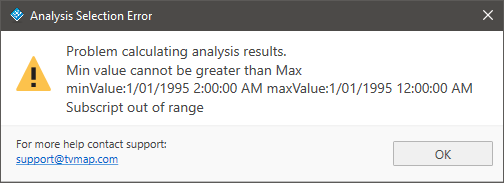
Check the dates you are using under Analysis Options - the minValue date indicates that this is as far back as you can go in the 'From' field under the Date section.
What does 'Problem calculating analysis results' mean?
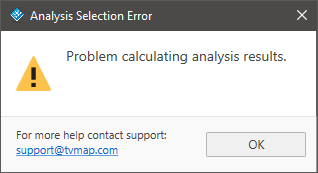
Check the parameters in the Analysis Options.
Could have date set to only one day but not have that day included in the Days of Week section i.e. Date is 18/10/2020 which is a Sunday but under Days of Week only midweek has been selected.