Provides quick Audience and Cost Analysis within Microsoft Excel.
Select the Analysis tile on the TVmap home screen.
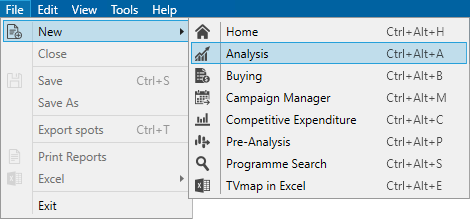
Or File > New > Analysis
Analysis Options
Select Analysis Options to enter parameters.
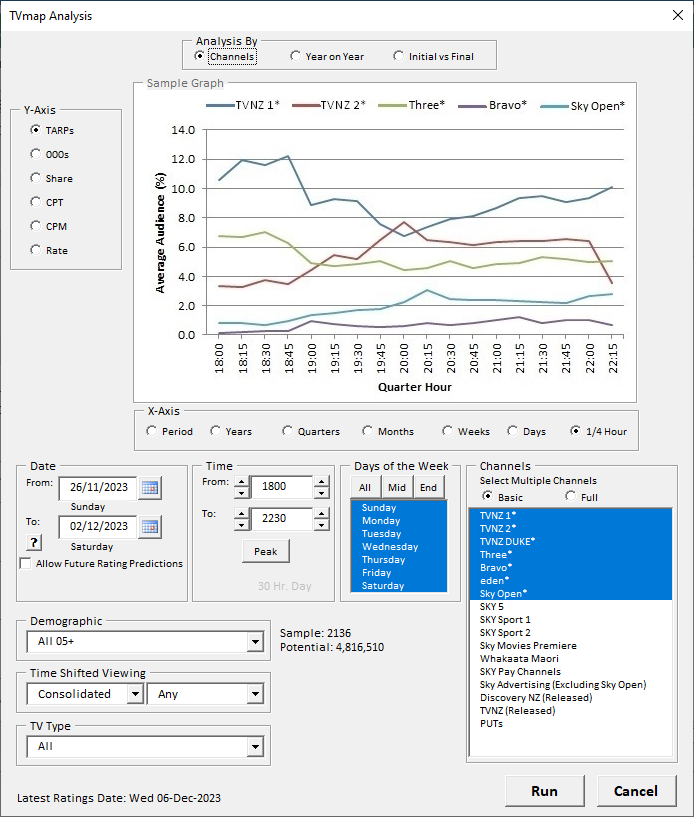
Edit the parameters as required.
Analysis By - Channels, Year on Year, Initial vs Final.
Y-Axis - Metric to be used e.g. TARPs, 000s, Share, CPT, CPM, Rate.
If using CPT, CPM or Rate the Commission option will become available. There are three options:
oNett of Disc - The published ratecard value
oNett of Disc & Commission - Deducting 20% commission from all spots except for TVNZ spots after 1 January 2011 which attract 10% commission
oGrossed to 20% - Taking the Nett of Commission rate and grossing this up to deliver a required commission rate of 20%
X-Axis - Unit of time e.g. Period, Years, Quarters, Months, Weeks, Days, 1/4 Hour.
Date - Enter from and to dates to be analysed.
To use future rating predictions select Allow Future Rating Predictions,select Advanced then enter Prediction Source Weeks to be used.
To enter future dates tick the Allow Future Rating Predictions checkbox.
Time - Enter times to be analysed. Select Peak to use peak times.
Days of the Week - Select the days of the week to be analysed. Select days individually or hold the Ctrl key while selecting or dragging. Alternatively, select All, Mid or End.
Channels - The basic list of channels is shown by default. Select days individually or hold the Ctrl key while selecting or dragging. Select Full to display the full list of channels.
Demographic - Select the demographic to be used for the analysis.
Time Shifted Viewing - Select from Overnight or Consolidated viewing.
TV Type - Select from All, Freeview or Sky.
Select Run to initiate the analysis run. Results will be displayed in a graph and table.
Multiple Analysis runs
Use the buttons below the graph to copy and paste data into a separate worksheet in order to analyse multiple analysis scenarios.
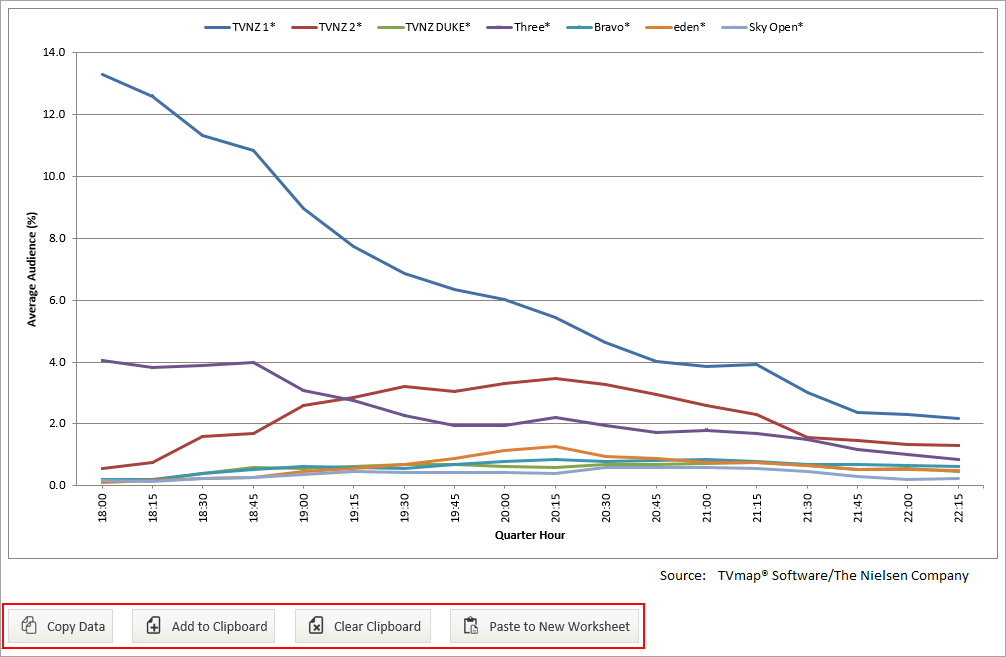
Copy Data - Select to copy the data in the table to the clipboard.
Add to Clipboard - Select to add to data stored in the clipboard. All data added to the clipboard will be pasted together into a new sheet/workbook.
Clear Clipboard - Clear data stored in the clipboard.
Paste to a New Worksheet - Paste data in the clipboard into a new worksheet.
* Excel® is a registered trademark of Microsoft Corporation
Have more questions? E-mail us: support@broadcastmap.co.nz or call us: +64 9 304 0762
|
|
©2026 Broadcast M.A.P. Limited. All Rights Reserved.
|