Buying Toolbar
Shortcut icons are available along the top toolbar in Buying.

A brief description of each icon is displayed when the mouse is hovered over the top.
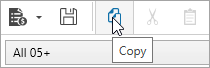
The available icons on the toolbar are Save, Copy, Cut, Paste, Undo and Redo.
![]()
Reports - view/print reports from spots booked in the Spot List tab. This icon is only available from the Spot List, Summary Analysis and Spot VO tabs.

Export to Excel - exports the current selection including grouping and filters to a Microsoft Excel spread sheet. The available options will change based on the current selection.
![]()
Options available are:
▪Export Grid to Excel
▪Export Selection to Excel
▪Export to Pivot Table
▪Link Spot Schedule to Excel Pivot
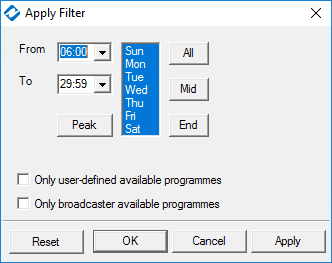
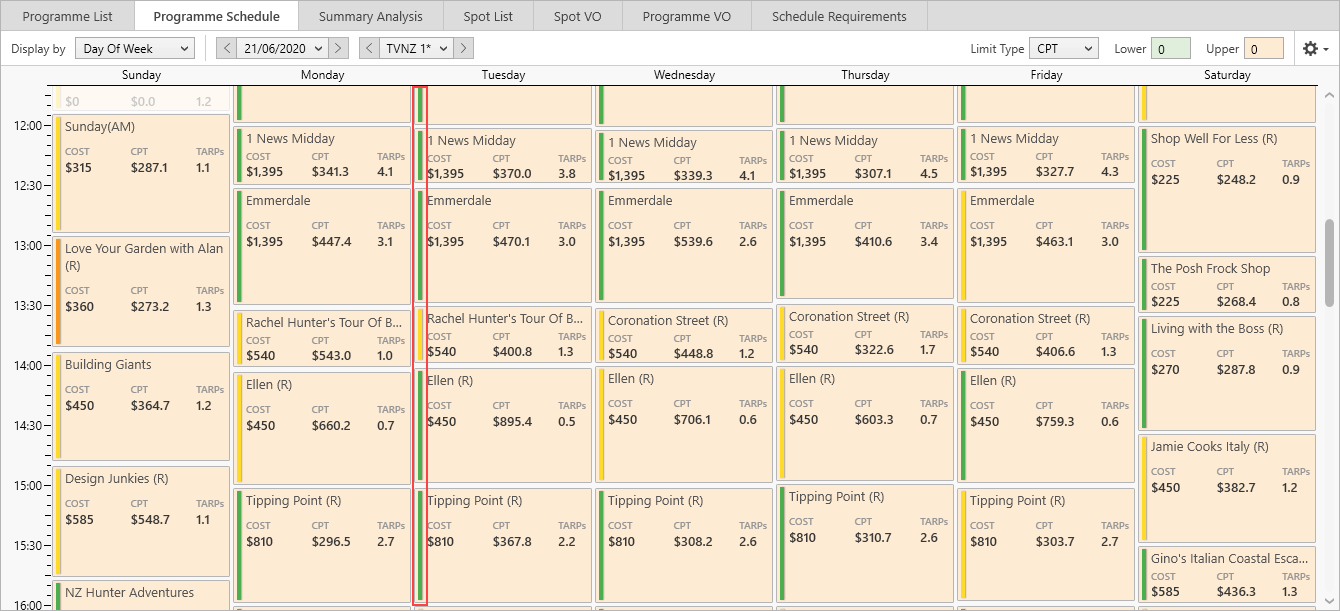
Filter - results can be filtered by time, day of the week, or programme availability.
![]()
Filters are content specific, options will vary depending on the tab selected.
Filtering by region and duration is available when the Spot List view is selected.
Reach and Frequency - select to run a Reach and Frequency after spots have been booked
![]()
Quarter Hour View - runs a quarter hour timeslot analysis based on the selected programme. Alternately right-click the selected programme and select Quarter Hour View.
![]()
Find Other Screenings - opens Programme Search using the selected programme name
![]()
Reload Broadcaster Availability - updates the Availability column with the latest spot availabilities
![]()
Demographic - select from the list of available demographics
![]()
Sample & Potential - displays the Sample and the Potential of the selected demographic
![]()
Nett of Discounts - there are three options available:
▪Nett of Discounts/VID - The published ratecard value including any applicable booking and Volume Incentive Discounts (VID)
▪Nett of Discounts/VID and Commission - Deducting 20% commission from all spots except for TVNZ spots after 1 January 2011 which attract 10% commission
▪Nett of Discounts/VID Grossed to 20% Commission - Taking the Nett of Commission rate and grossing this up to deliver a required commission rate of 20%
![]()
VST (Viewing Session Type) - select from Consolidated or Overnight ratings data
![]()
Cumulative Frequency Distribution
This shows a summary of Cumulative Frequency Distribution (CFD) for the buy. A full R&F can be obtained using the R&F icon from the toolbar.
![]()
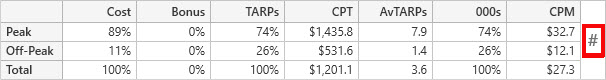
Buy Accumulator
This table auto updates based off the primary demographic, to give a summary of Cost, Bonus, TARPs, CPT, AvTARP, 000s and CPM for the buy, split by Peak and Off-Peak.
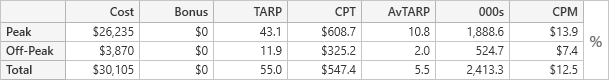
To change the buy accumulator screen to show actual values click on the % icon
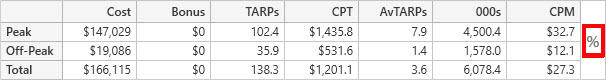
To change back to showing percentage values click on the # icon
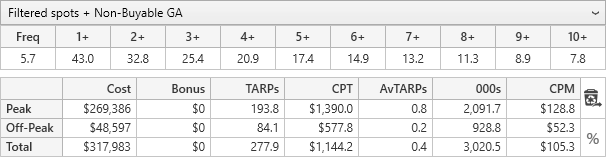
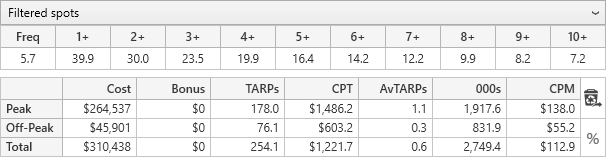
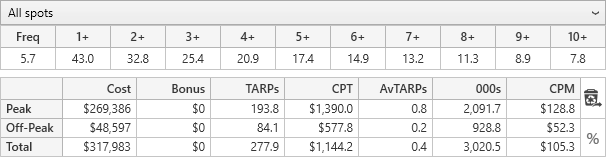
Quickly see filtered or all spots by clicking the header to change options.
There are three different filter options available. Click on the heading to toggle the setting of the filter option.
1.Filtered spots + Non-Buyable GA
Includes filters along with all GA items (non-buyable & buyable stations)
2.Filtered spots
Includes any filters along with GA items for buyable stations (excludes non-buyable stations
3.All spots
Will display the totals for all spots & GA items in the buy (i.e. filters are ignored)
The default option for a new buy is Filtered spots + Non-Buyable GA.
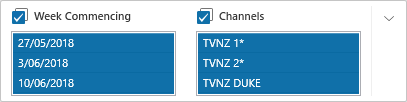
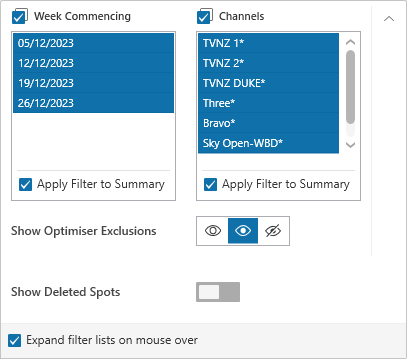
Buy Filters
Select to filter by Week Commencing and Channel.
All week commencing and channels are selected by default.
Select the expand icon ![]() to expand the window and change the filter options.
to expand the window and change the filter options.
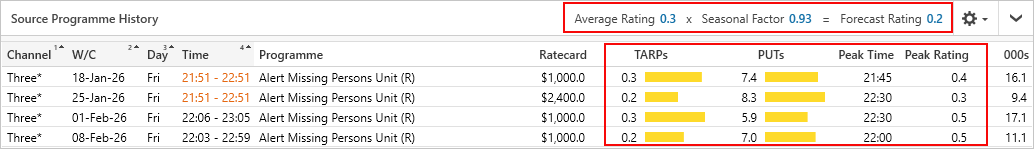
Source Programme History
When a spot is selected, the Source Programme History grid at the bottom of the screen will show information based on the Source Weeks that were selected when the Buy was opened/saved.
It details the cost, TARPs, peak time, peak rating, and 000s for the time zone of the selected spot. This appears in a graph format under the TARP column for the selected source weeks and is available in the Programme List, Programme Schedule and Spot List tabs.
Source programming is important in determining how accurate rating predictions will be. In general, if the source programme information is stable, this will result in the most accurate predictions. If the source programme information shows large variations or special event programmes, manually overriding the rating predications should be considered.
At the top of the source history TVmap displays the calculation of the predicted rating showing the seasonal factor which is being applied to the programme.
The source programme pane also shows the peak time and rating for the source weeks to help determine the best break time within the programme.
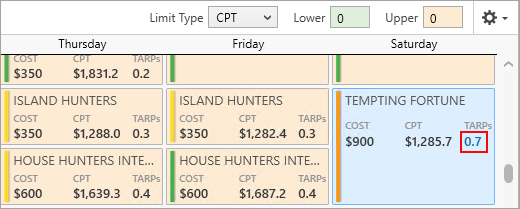
PUTs and TARPs show overall and channel specific performance, which helps you see if variations have been caused by individual programming or total viewing.
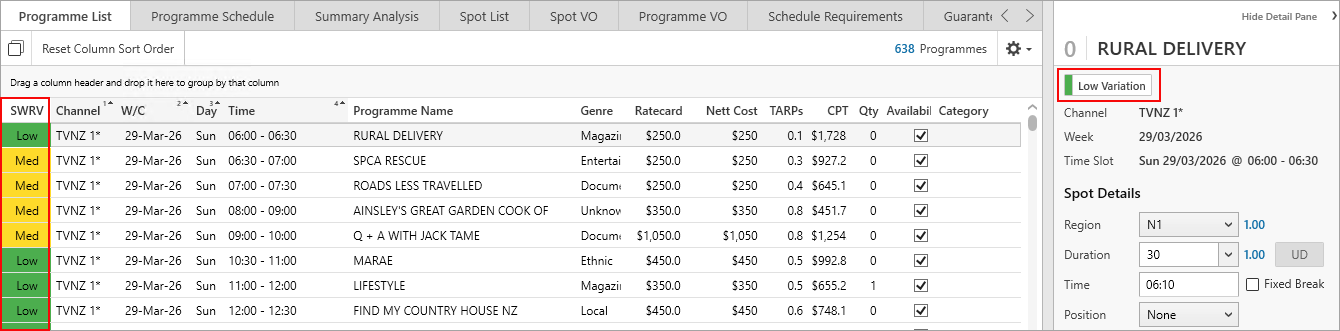
To highlight source week variation, the rating column is coloured to indicate the level of variation.
•Green = low variation
•Yellow = moderate variation
•Orange = high variation
Can order spots by ratings variation by simply clicking on the SWRV column to sort in the Programme List or Spot List. The details pane to the right side of the screen will also display the variation on the spot selected.
Manual override of ratings can be carried out by simply overriding the TVmap estimates with your own estimated rating and can be done at a programme or spot level. Overridden ratings will show in bold to highlight where manual adjustments have been carried out.
Find Other Screenings
In the example below Love Your Garden with Alan is showing a high variance. Looking at the Source Programme History we can see that on the 30-August-20 there was a breaking news programme that had a rating of 4.7 TARPs which when compared to the ratings of First Crossings was much higher. This meant the Average Rating was 1.6 and the Forecast Rating 1.7.
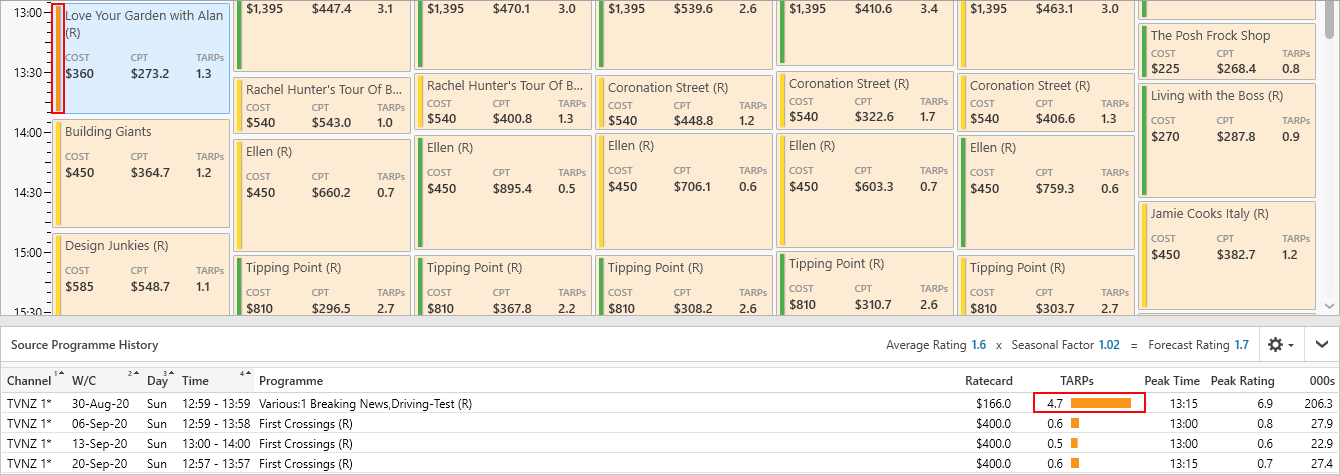
Because this programme has not been on air at this time in the last 4 weeks it would be best to use the Find Other Screenings option to see how past screenings rated when modifying the rating.
Customizing columns
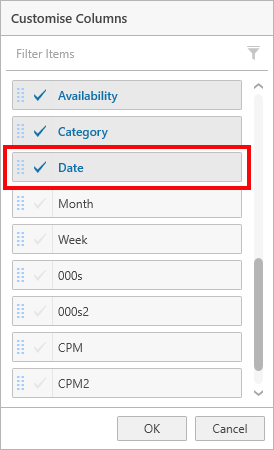
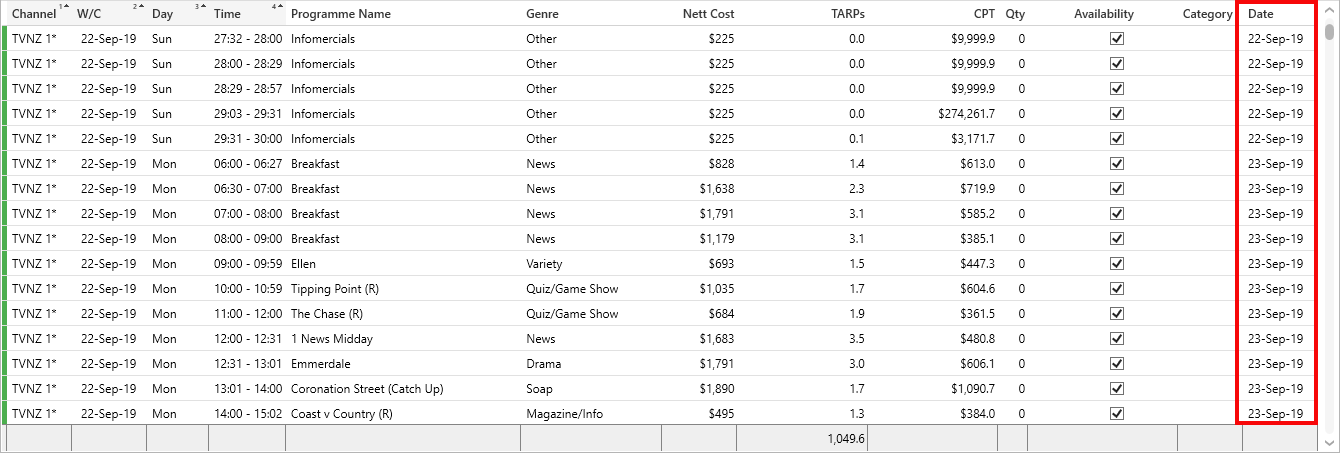
Select![]() to add or remove columns, for example can add the Date column to see the actual date.
to add or remove columns, for example can add the Date column to see the actual date.
Have more questions? E-mail us: support@broadcastmap.co.nz or call us: +64 9 304 0762
|
|
©2026 Broadcast M.A.P. Limited. All Rights Reserved.
|