________________________________________________________________________________
Contents
How to use Pivot Tables to show Advertiser rather than Category
How to use pivot table options to report by calendar month using Weekly reports
How to view performance of advertisements in TVmap
_______________________________________________________________________________
How to use Pivot Tables to show Advertiser rather than Category
When running the Wkly TV TARP by Advertiser report you can use the Pivot Table function to display Advertiser rather then Category.
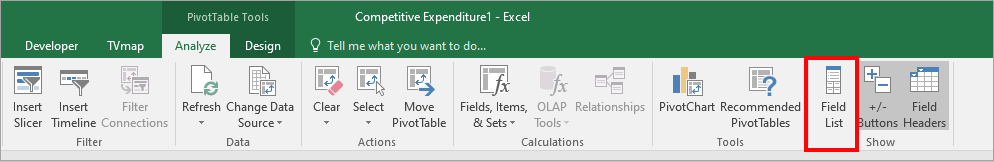
Once the report has run click any where in the results table. This will bring up the PivotTable Tools option in the toolbar.
Select the Field List option
This will bring up the Field List options for the Pivot Table
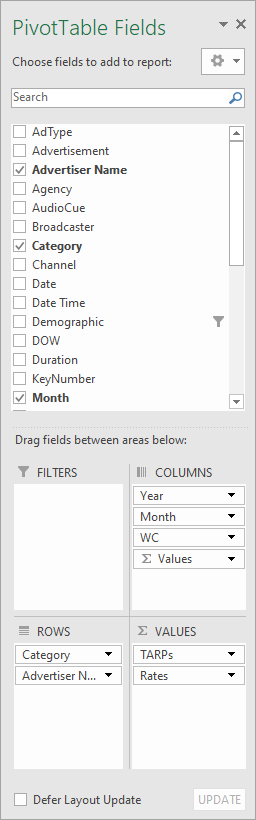
Under ROWS click on Category then drag it up to Field List options section
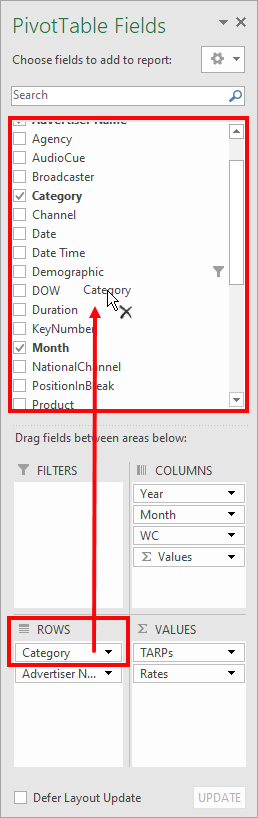
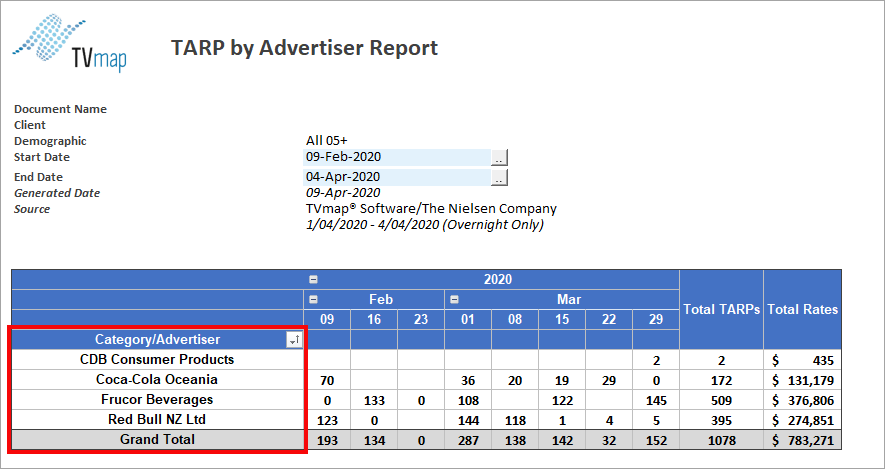
This will remove Category from the table so it now just displays Advertiser Name
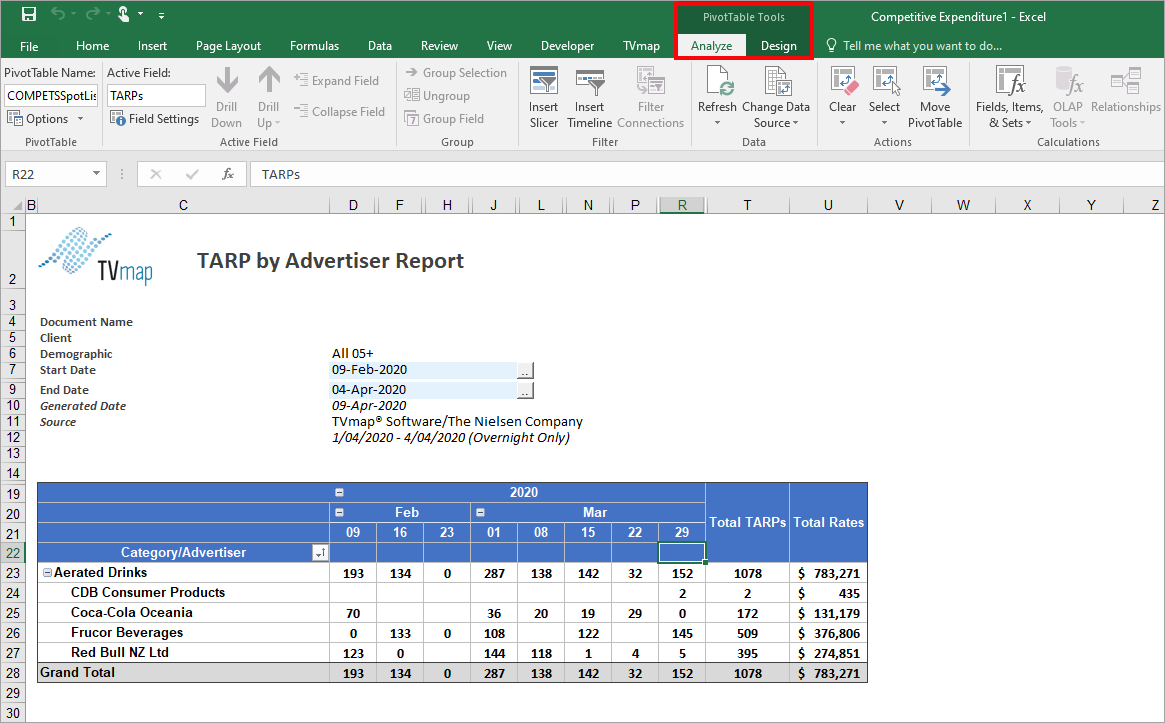
How to use pivot table options to report by calendar month using Weekly reports
Following similar steps in the how to above you can use the pivot table options to display the Weekly reports by calendar month rather than week.
Once you've run your report bring up the pivot table options and go to Field List.
From under the Columns section click on WC and drag it up to the main field list to remove it from the table.
Spots will now be aggregated under the calendar month the spot aired in.
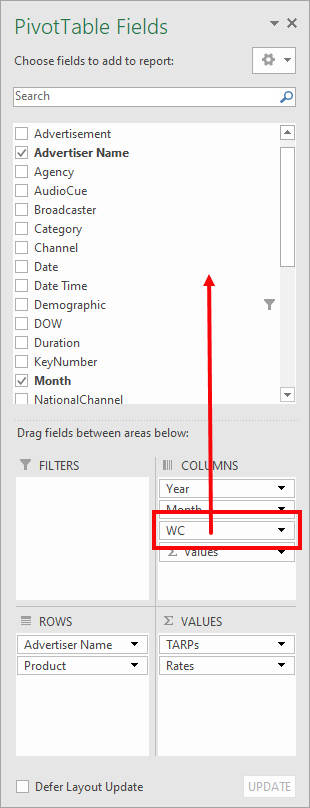
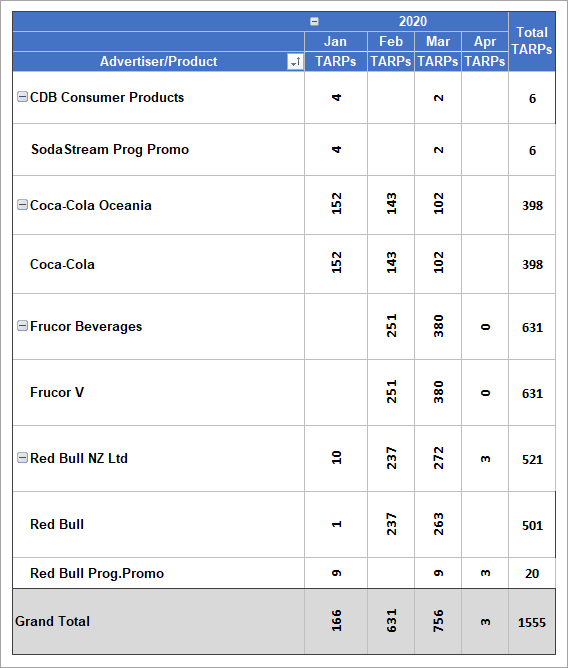
Table results will now display month
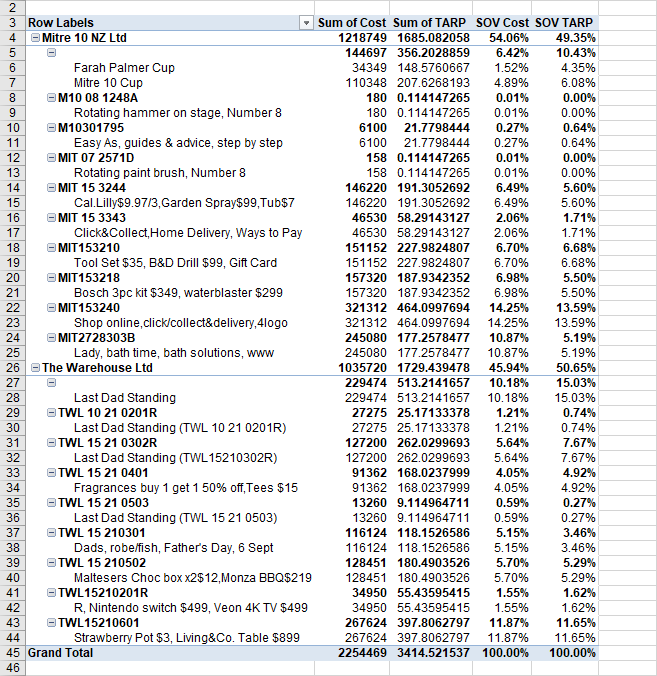
How to view performance of advertisements in TVmap
This can be done using the TV Spot List report.
Under Edit Set select the required advertisers for the report.
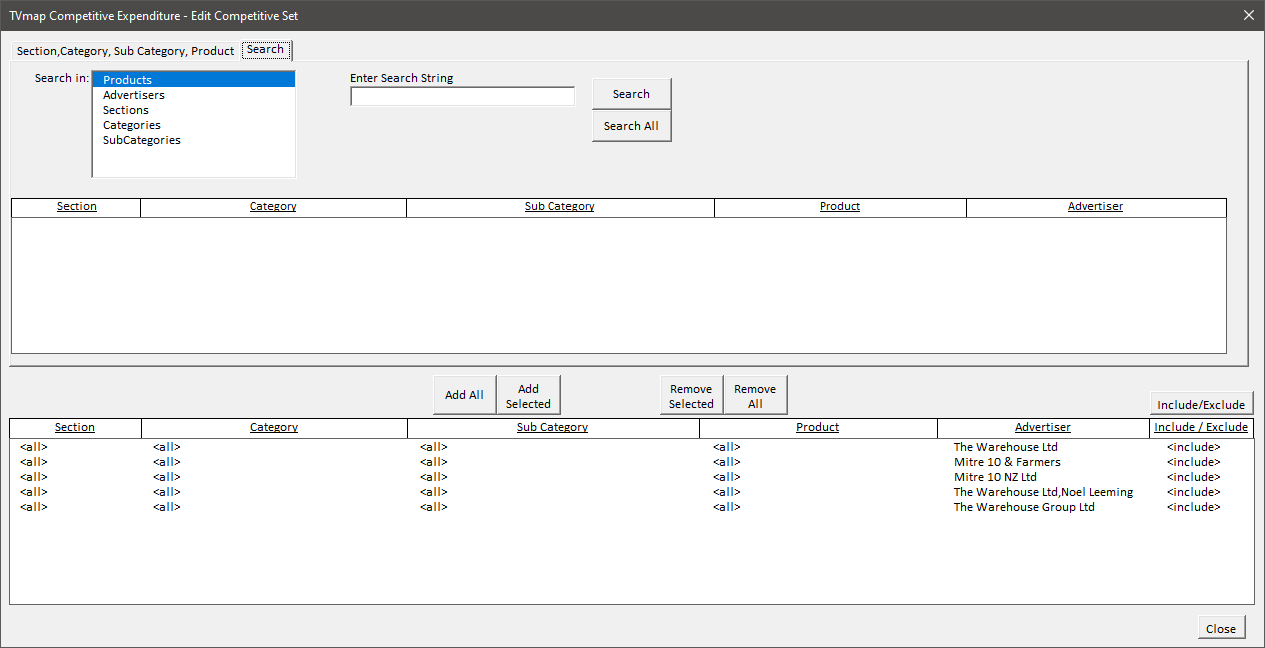
Under Select Reports add the TV Spot List report. Make changes to the date range as required.
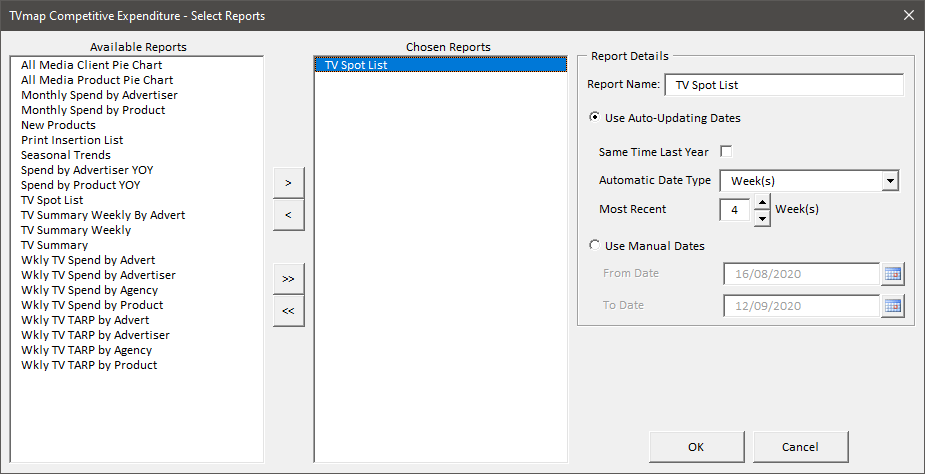
Click Run to run
From here you can create a pivot table in a new spreadsheet tab, which will enable you to see performance per advert.
Highlight all the results in the TV Spot List tab, then select Pivot Table.
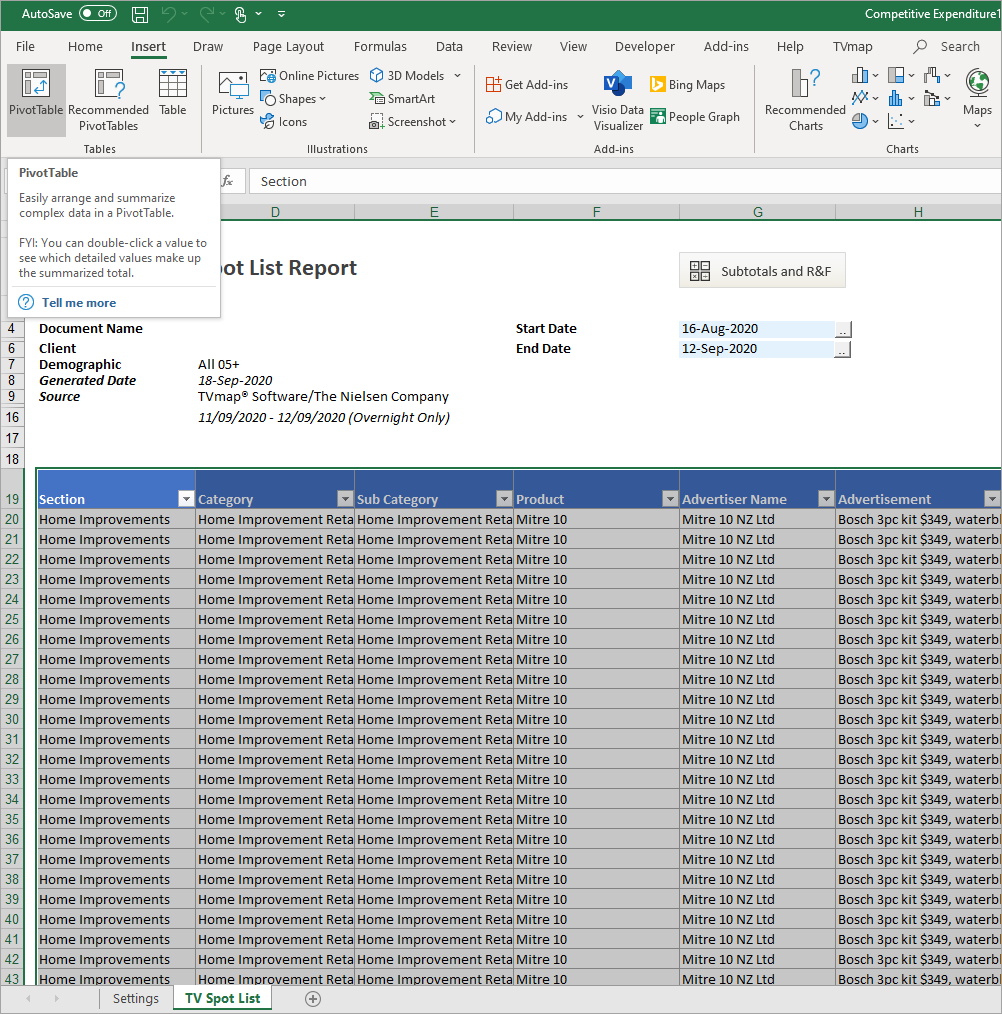
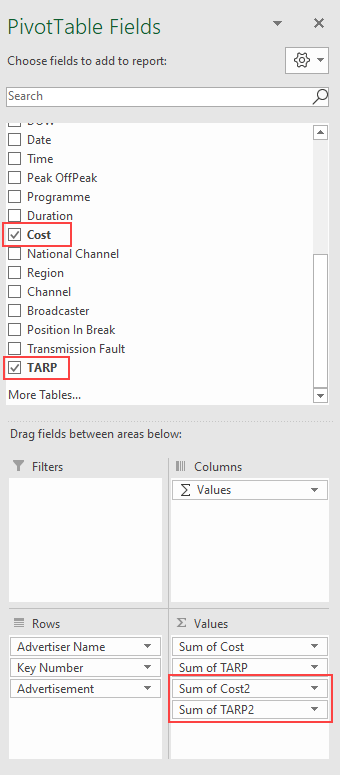
Group the columns in a relationship similar to the below to get the desired results.
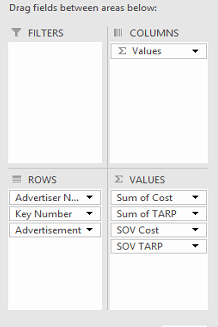
Here is how to get SOV Cost & SOV TARP
Add the Cost and TARP again to the Values section.
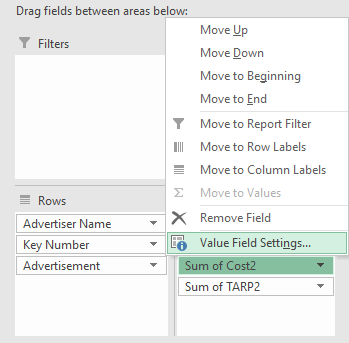
Click the drop down option next to Sum of Cost2 and select Value Field Settings.
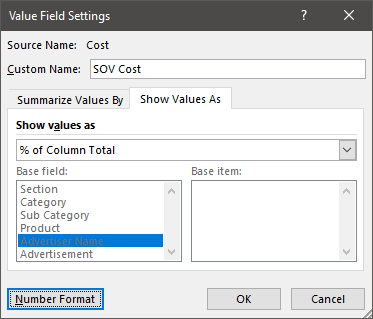
Change the Custom Name to SOV Cost and on the Show Value As tab select % of Column Total from the drop down.
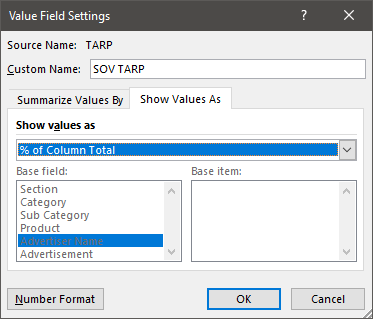
Follow the same step for SOV TARP
After this you can manipulate the columns and rows as needed in the right hand pane.