Post Analysis uses data from Nielsen Television Audience Measurement to obtain a post air spot list for a category, product or advertiser, for a specific date range and demographic. Reach and Frequency reports can be generated against spots returned.
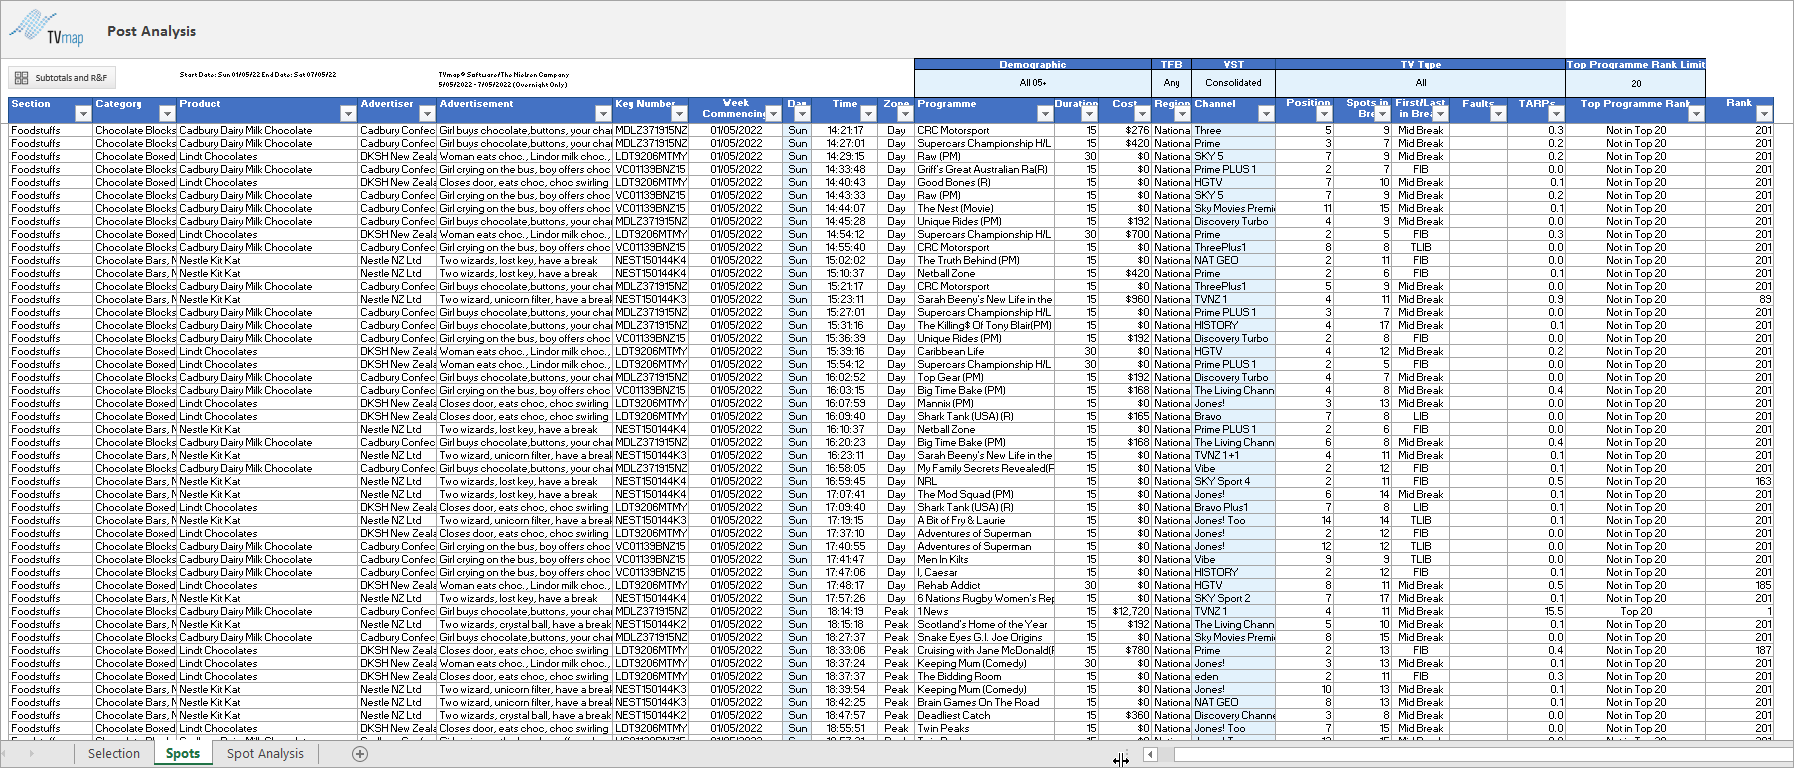
The report includes the Position, Spots in Break, First/Last in Break, Top Programmes and Rank for aired spots.
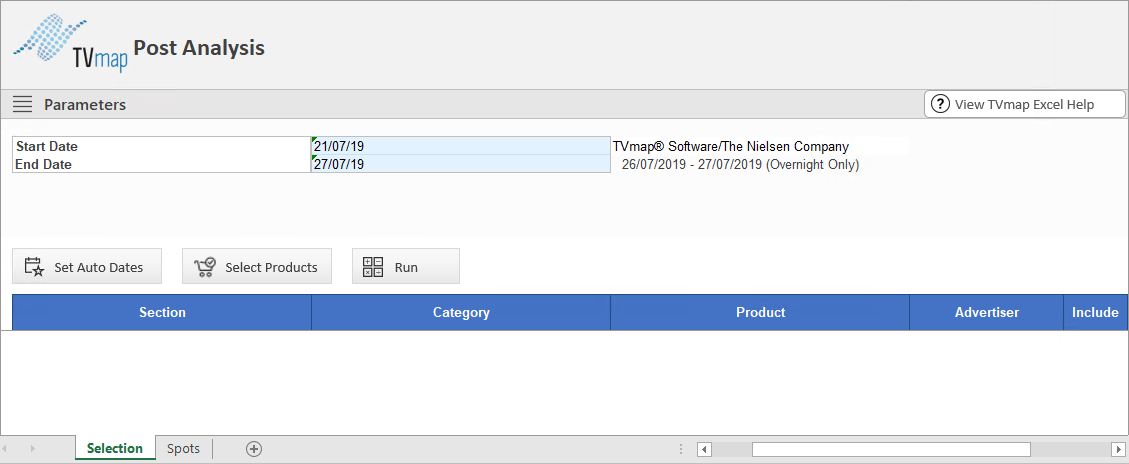
Edit Parameters as required:
▪Start Date
▪End Date
![]()
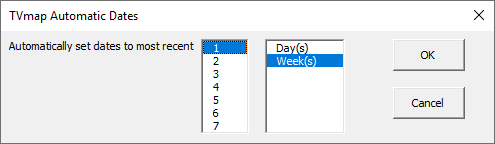
Set Auto Dates allows dates to be automatically set to the most recent weeks or days.
![]()
Select preferred date range.
Click the Select Products window to open the TVmap Product Selection window. Select the category, product or advertiser to run the report against.
![]()
Use first tab to add an entire Section,Category or Product.
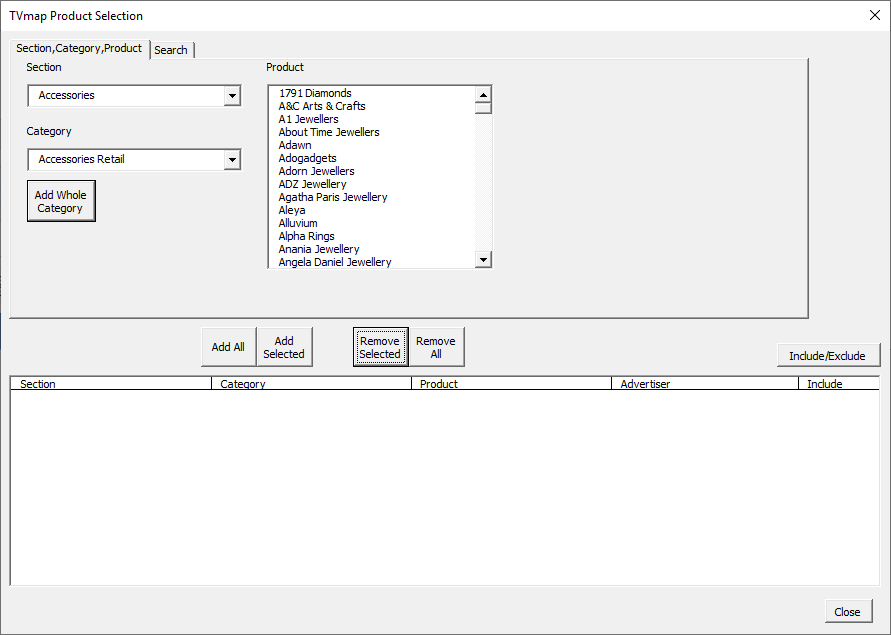
Alternatively, search for the category/product/advertiser using the Search tab.
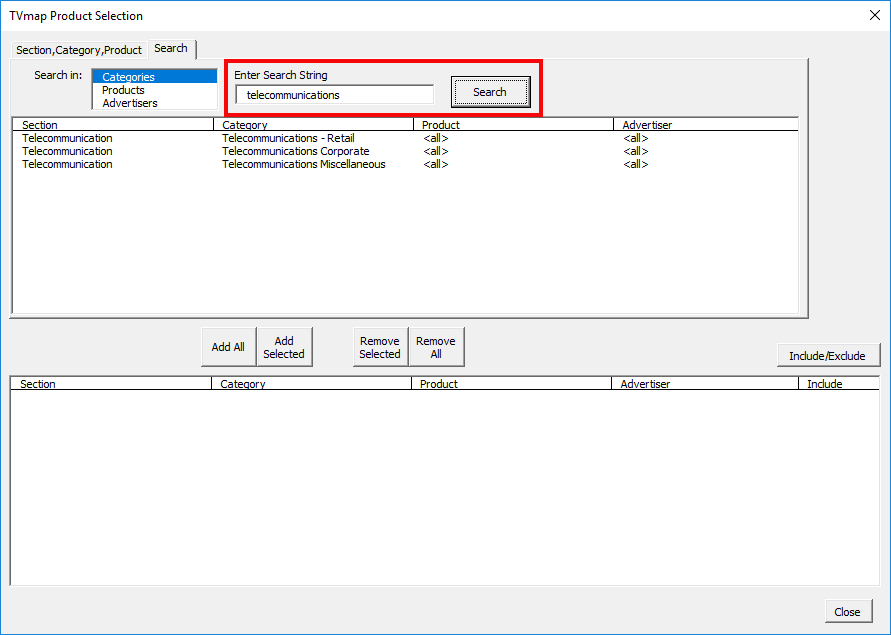
Once selections have been added click Close.
The added category/product/advertiser will now display on the main screen.
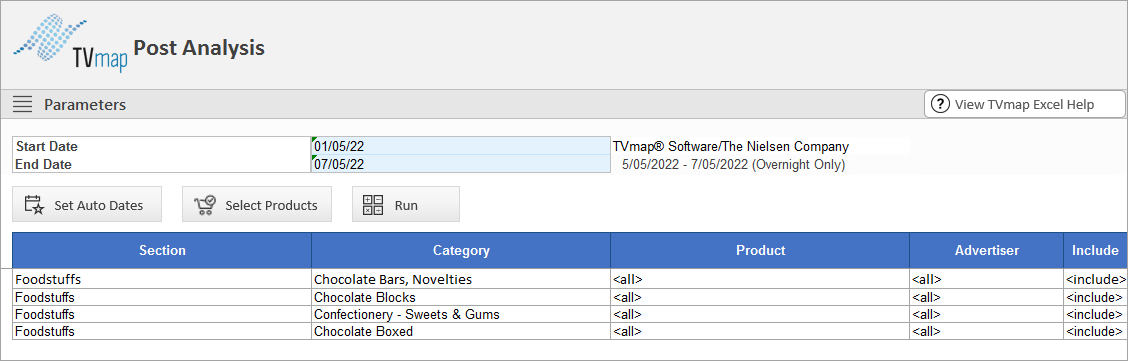
Click Run
![]()
Once the report has run it will automatically switch to the Spots tab displaying the results.
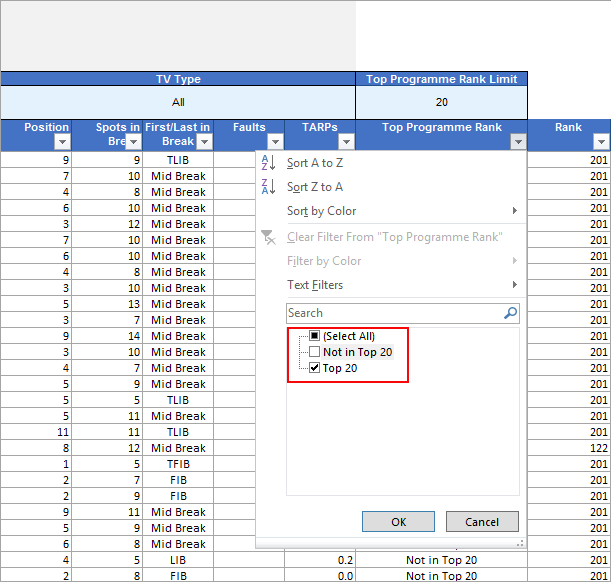
Can filter Top Programmes to show what was in Top 20.
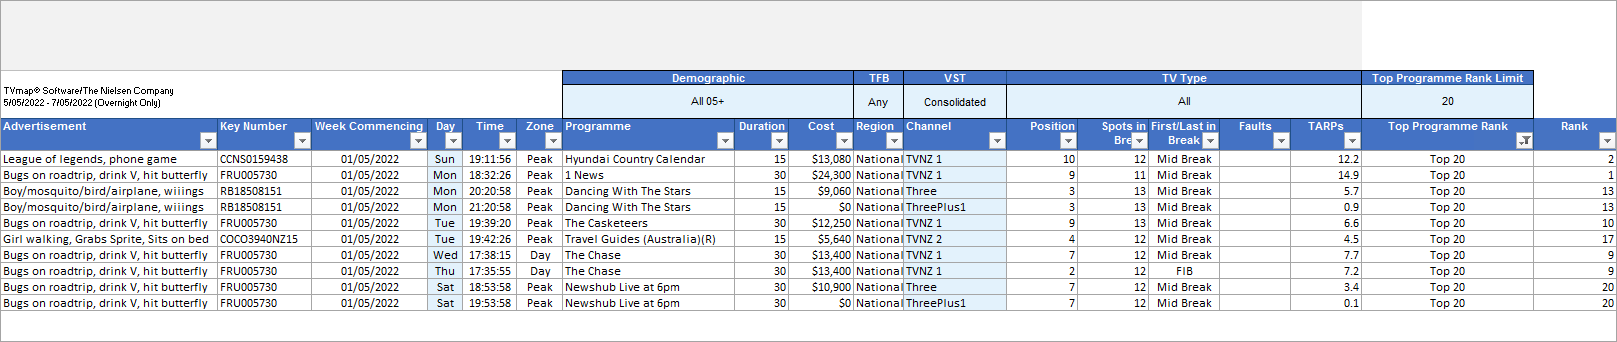
Rank is the Top Programme ranking. If you use top 200 and your programme doesn't appear in the top 200 then 201 will appear. If you changed it to top 50 then it would show the ranking for spots which fall in the top 50 and for anything outside this is the template would show 51.
To run an R&F click on Subtotals and R&F
![]()
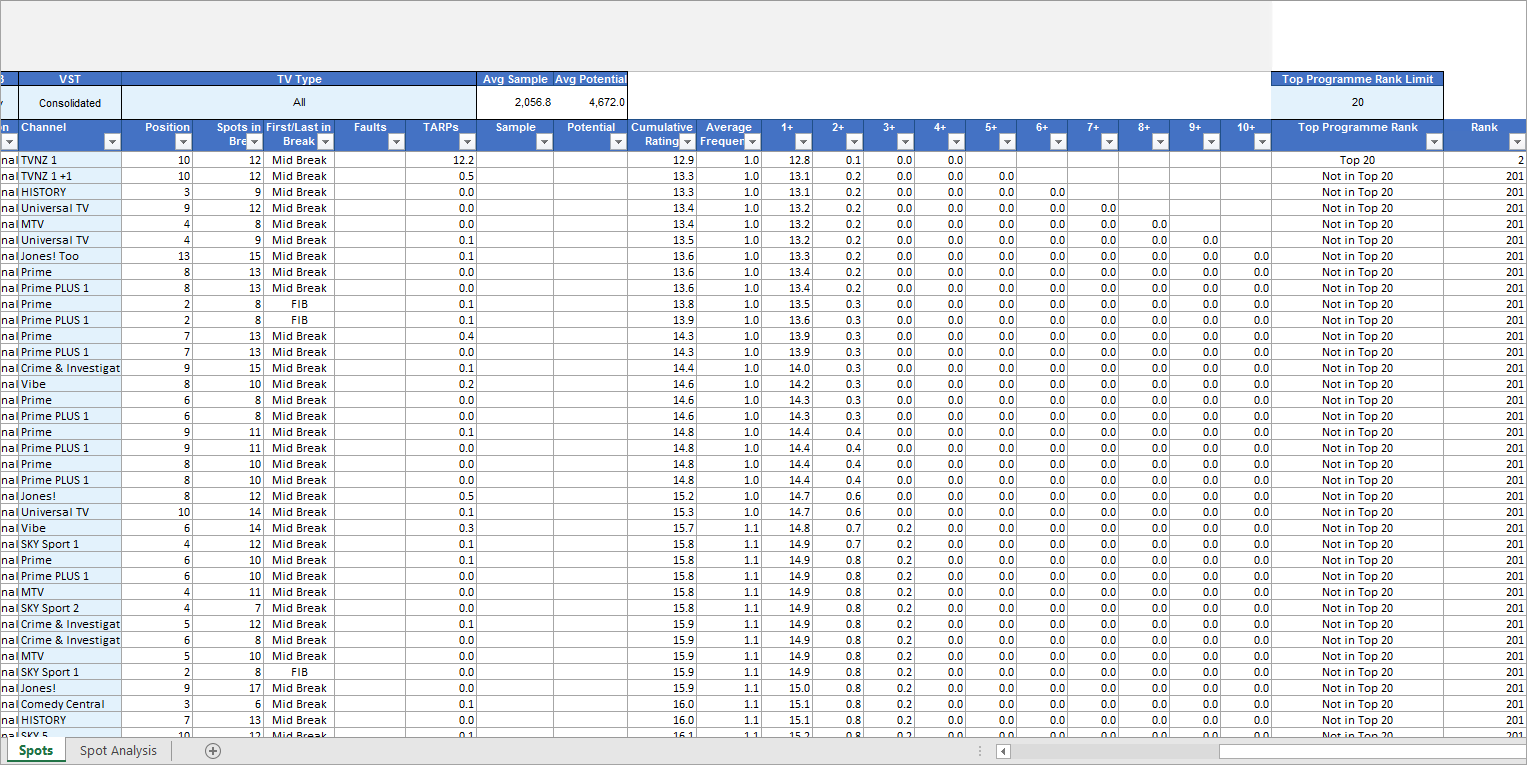
Choose from the Output Summary Options and click OK.
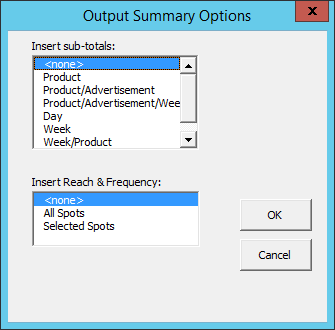
R&F results will appear on the right side of the report.
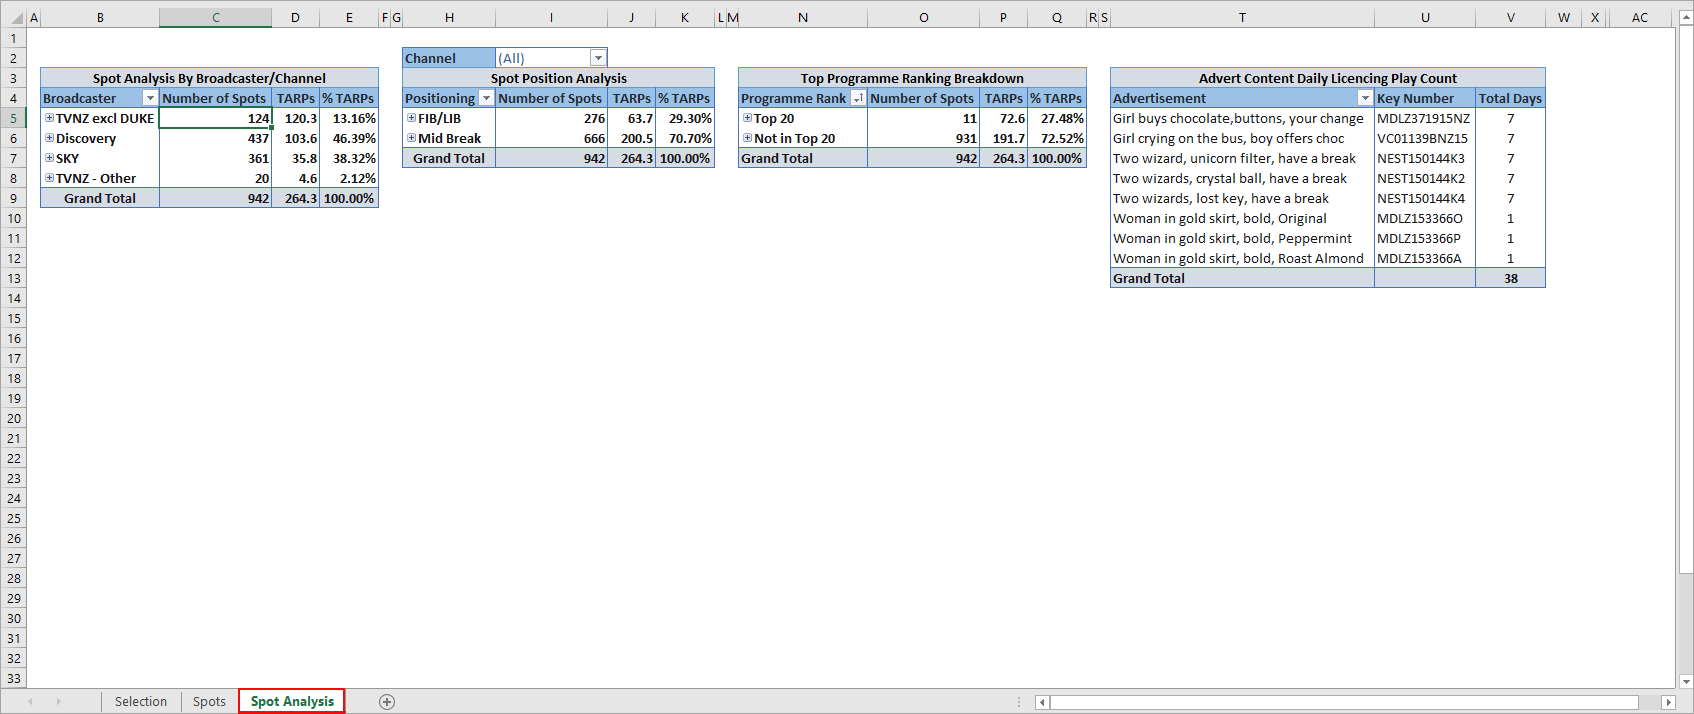
The Spot Analysis tab provides a pivot table summary by Broadcaster, Spot Position and Top Programme Ranking.
This also includes a distinct day play count summary for creative licensing reporting.