________________________________________________________________________________
Contents
How to update a channel using the TVmap Tab
How can I get a list of what demographics are available within my TVmap?
How can I display the unique viewing numbers (1+ Reach) for a specific programme?
How do I get the 30” equivalent TARPs in Post Analysis?
How can I see ratings for two different demographics in Top Programmes?
How do I group the programmes that appear in the results of the Top Programmes template?
How can I see the total number of people in 000s rather than TARPs?
How to add more channels to Top Programmes
Can Average Cume 000s be Totaled for a Particular Period?
How to get Average Cume Audience Based off 1 Month Averages for a 6 Month Period
How can I see the average number of TV viewing minutes in a typical week?
What is the minimum time required to register a value in Time Spent Viewing?
How can I run a total R&F for multiple Key Numbers in Post Analysis?
________________________________________________________________________________
How to update a channel using the TVmap Tab
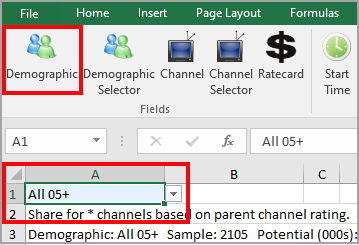
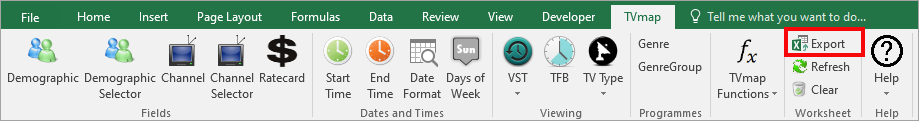
Select the cell containing the channel to change, then select the TVmap Tab in the Excel ribbon

Select Channel Selector, then the Station Selector window will open.
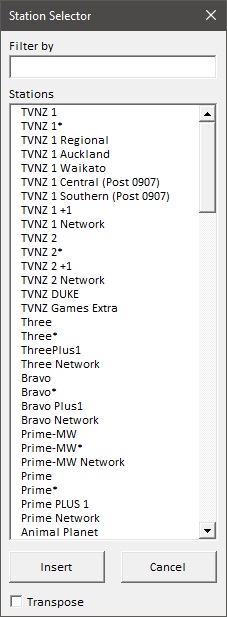
In the Filter box enter part of the channel name.
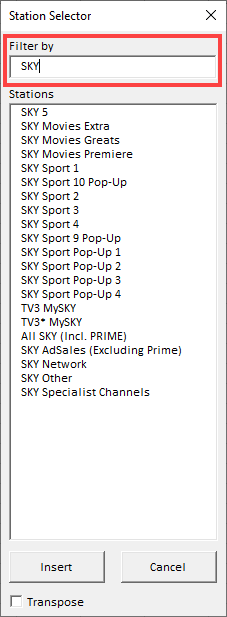
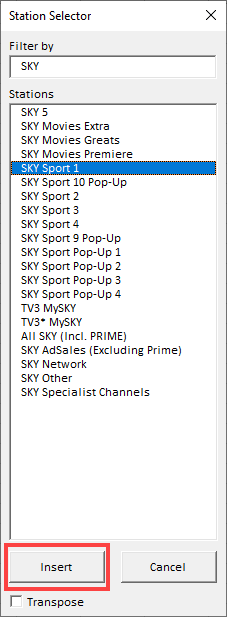
Select the channel, then select insert.
How can I get a list of what demographics are available within my TVmap?
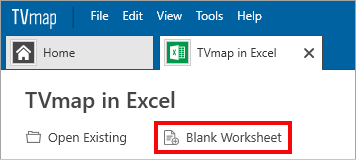
To get a list of what demographics you have access to you can use TVmap in Excel.
Go to TVmap Excel and click on Blank Worksheet to open a new blank worksheet.
Click on the View tab and then on Unhide - the unhide window will pop up
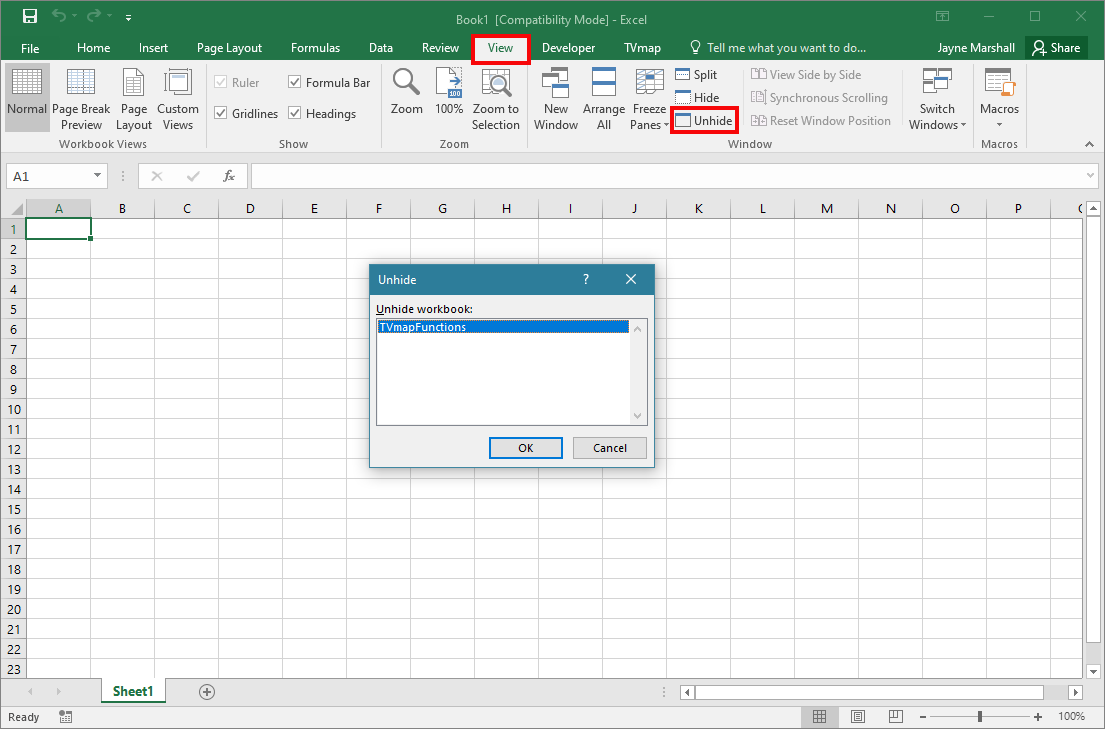
Click OK to unhide
Column E will have the list of demographics that are available to you
To hide the sheet go to View and click Hide

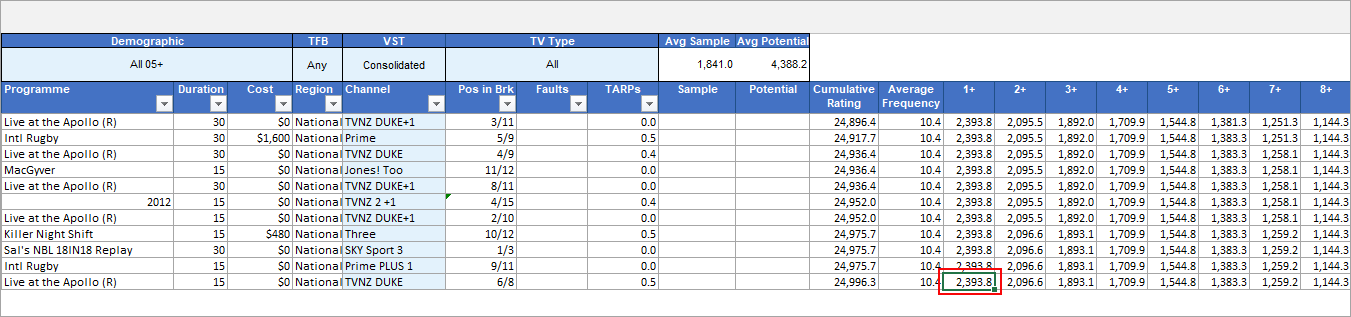
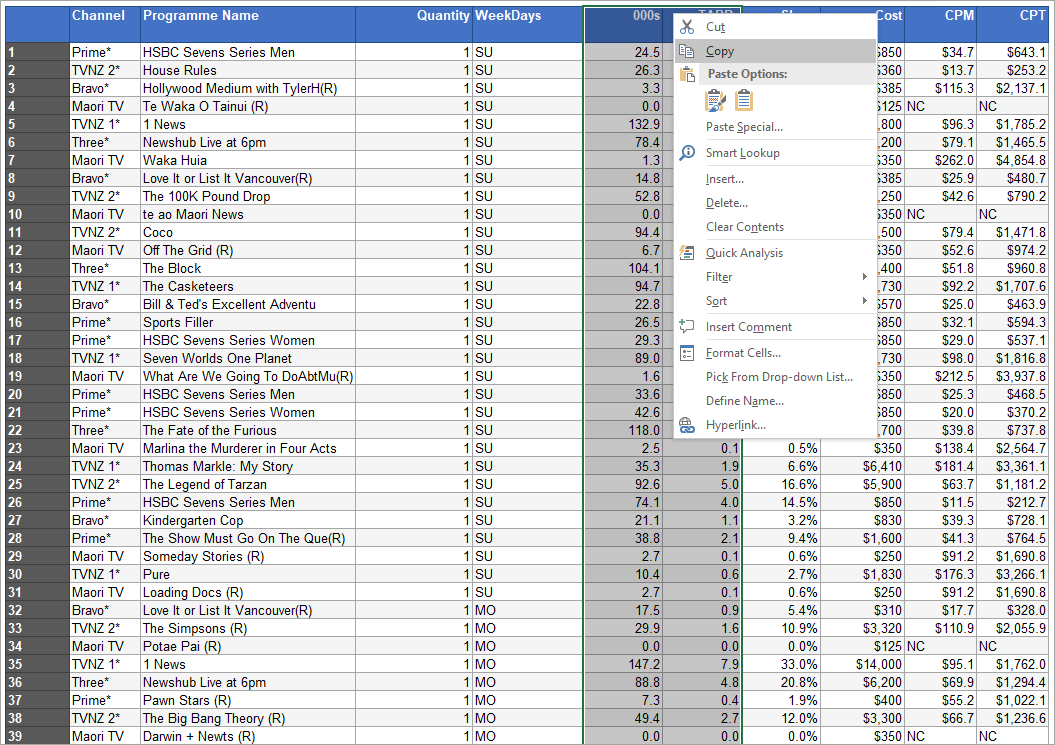
How can I see the total number of people in 000s rather than TARPs?
Run an R&F on the Post Analysis as per below.
Once it has generated the results click on the first cell containing the sample and highlight the portion of the formula saying TARP.
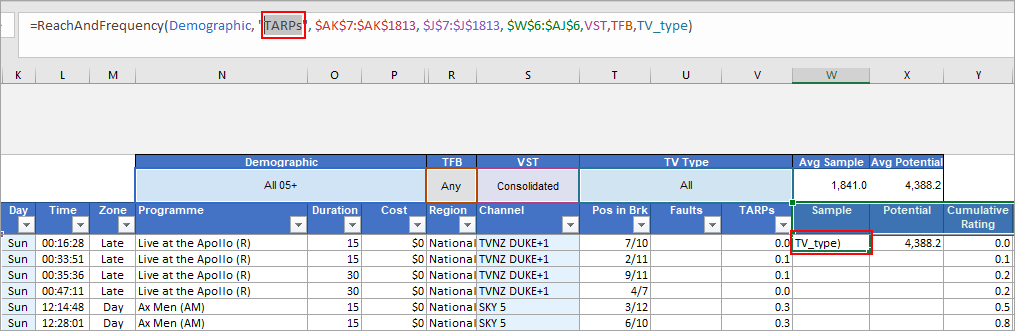
Replace TARP with 000, then hit the Ctrl, Shift and the Enter keys at the same time.
This is important as it’s an array formula, so this puts the curly braces around the formula and applies this to all of the cells for the R&F.
![]()
Potential will be automatically updated to 000s.
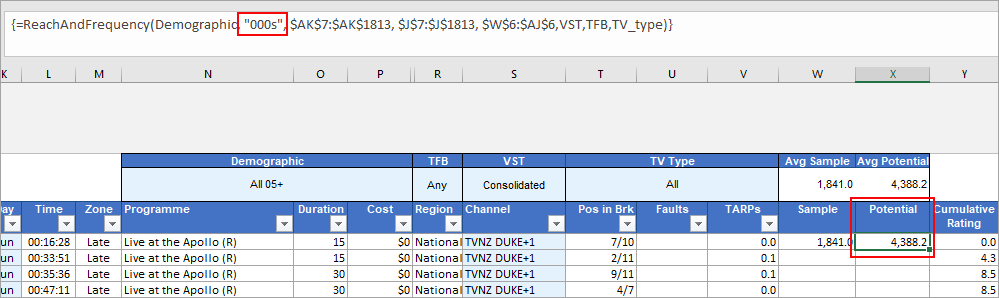
The 1+ result at the bottom of the column will now give you the total number of people in 000s who have seen the ads at least once.
Cumulative Rating will give the total exposure in 000s but this will count some people multiple times.
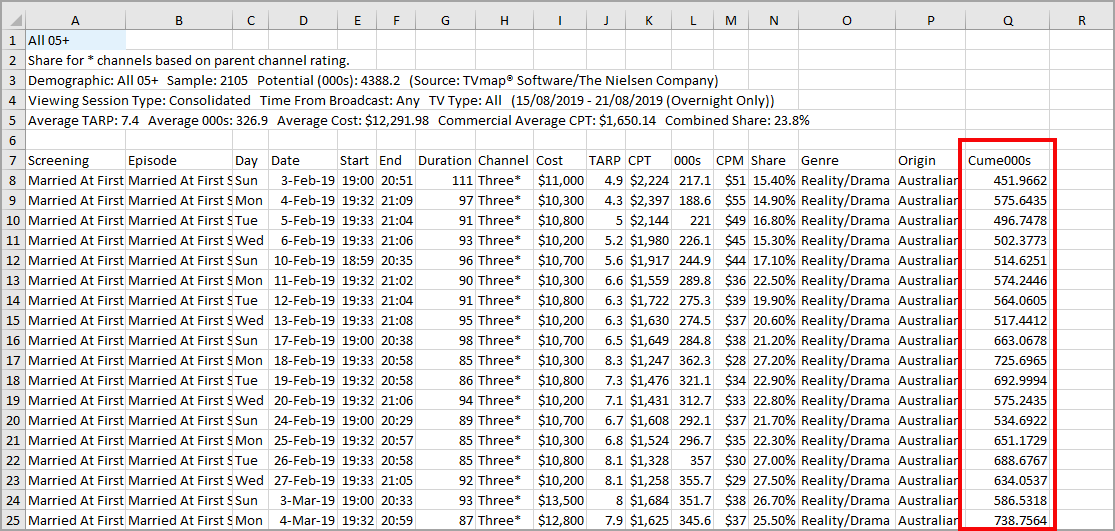
How can I display the unique viewing numbers (1+ Reach) for a specific programme?
You can use Programme Search and the TVmap Functions to get Cume000s for specific programmes
Open TVmap and go into TVmap in Excel
Click on Blank Worksheet to open a blank Excel spreadsheet (keep this open in the background)

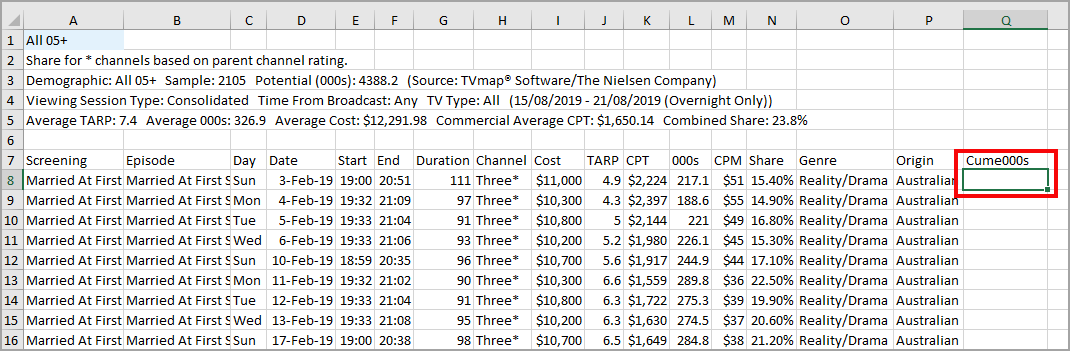
Open Program Search and search for the program you want to get the Cume000s for
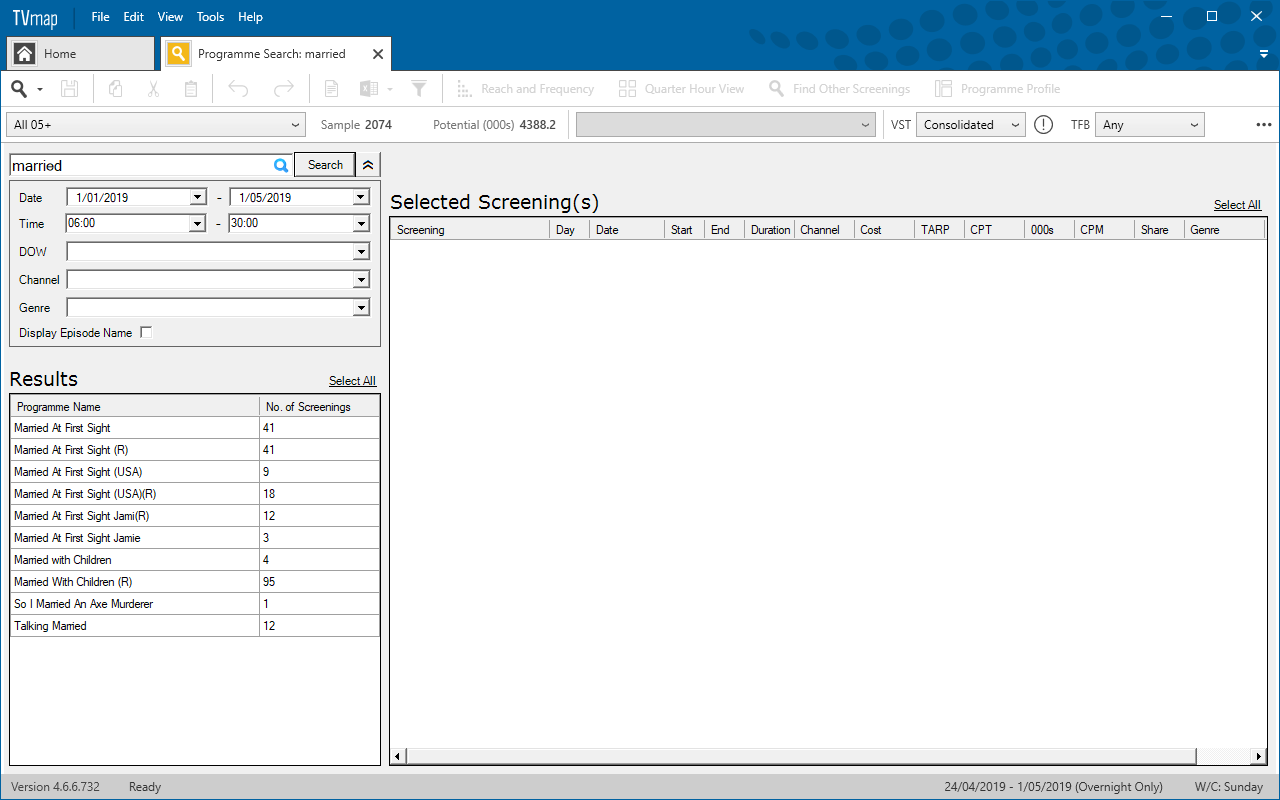
Select the program and screening/s you want
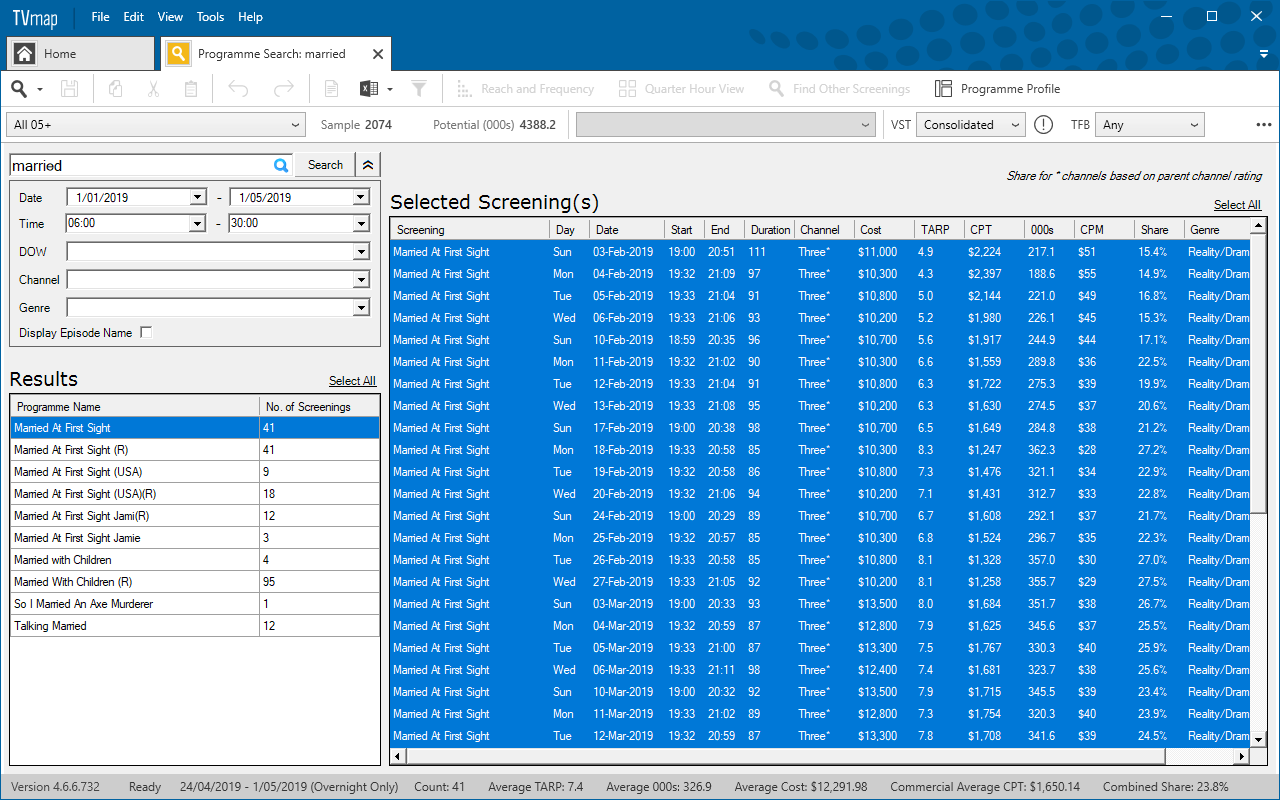
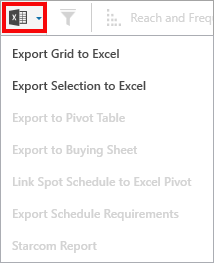
Under the Excel icon select either Export Grid to Excel or Export selection to Excel depending on what you have selected
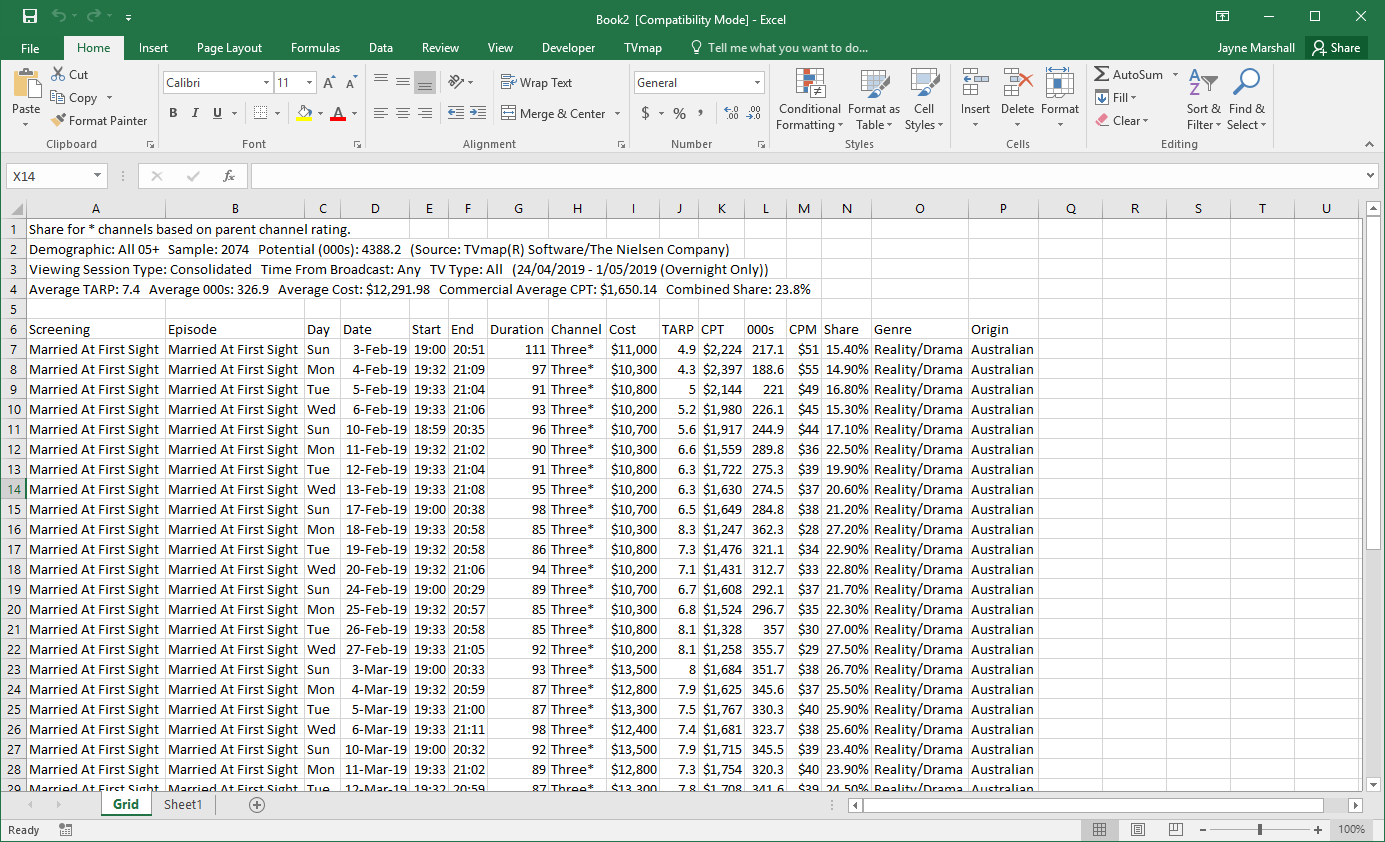
An Excel window will appear with the exported information
Insert a new row at the top
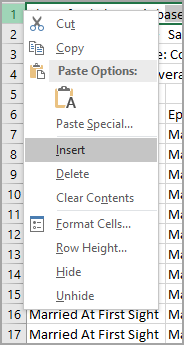
A new blank row should appear in row 1
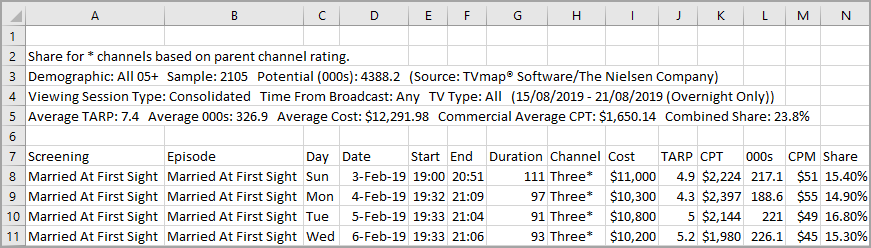
Click onto the TVmap tab at the top of Excel

Click on cell A1 so it’s selected, then in the TVmap Tab click on Demographic. This will add demographic to the sheet so you can set the demographic you wish to run the Cume000s against.
Choose what cell you want your Cume000s to go – in this example, we are using cell Q8
Back in the TVmap tab select TVmap Functions and select Cume000s from the drop down options
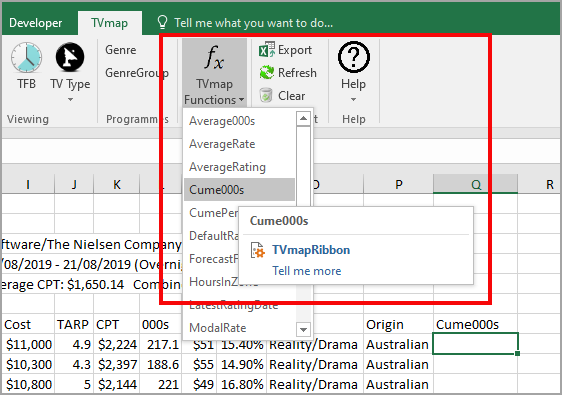
The Function Arguments window will pop up
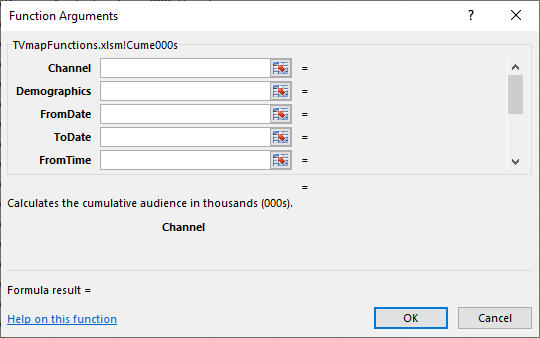
Fill out the fields required using the information you exported from Programme Search and the Demographic cell you added.
▪Channel will be Channel column
▪In Demographics put a $ before the A and 1 and it will make is a locked cell, so when you copy down the formula it will remain using that cell
▪FromDate and ToDate will be the same date as there is only one date available which is in the Date column
▪FromTime will be Start column
▪ToTime will be End column
▪DayMask will be Day column
Note: You should only need to fill out to DayMask to get results
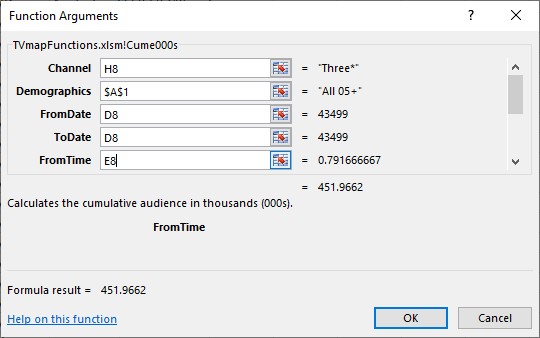
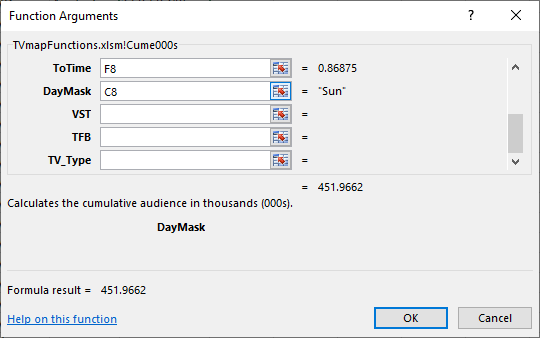
Click OK – you should now see the result in the cell you selected to run the formula in
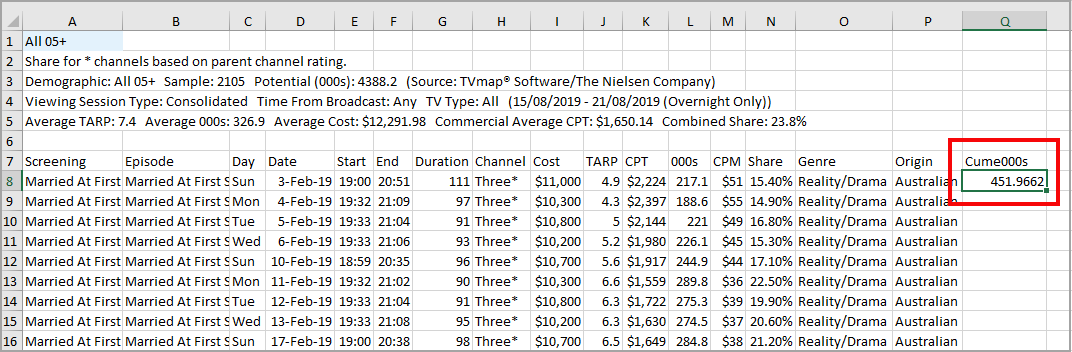
Drag the corner of the green box down to copy formula into cells below
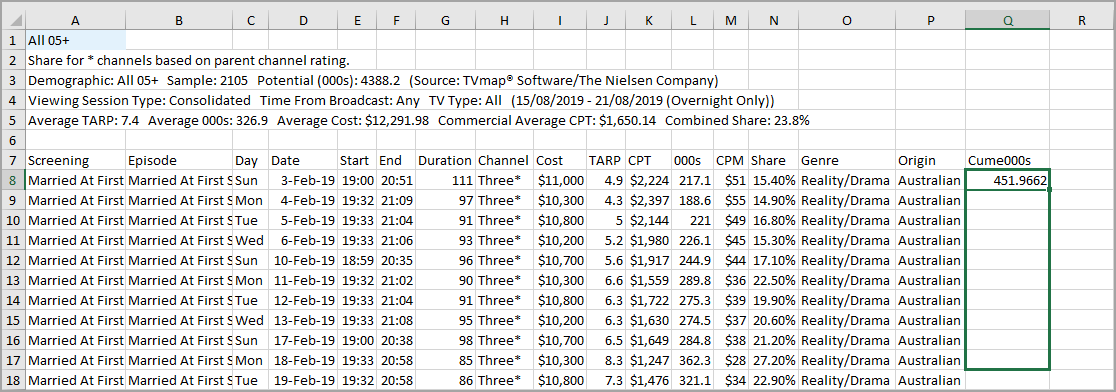
You should now have Cume000 results
How do I get the 30” equivalent TARPs in Post Analysis?
30" equivalent TARPs is not currently in the Post-Analysis template.
Use a formula to get a rough idea of what they would be.
Here is the formula: =IF(O7=15,V7*0.6,V7) see the example below.
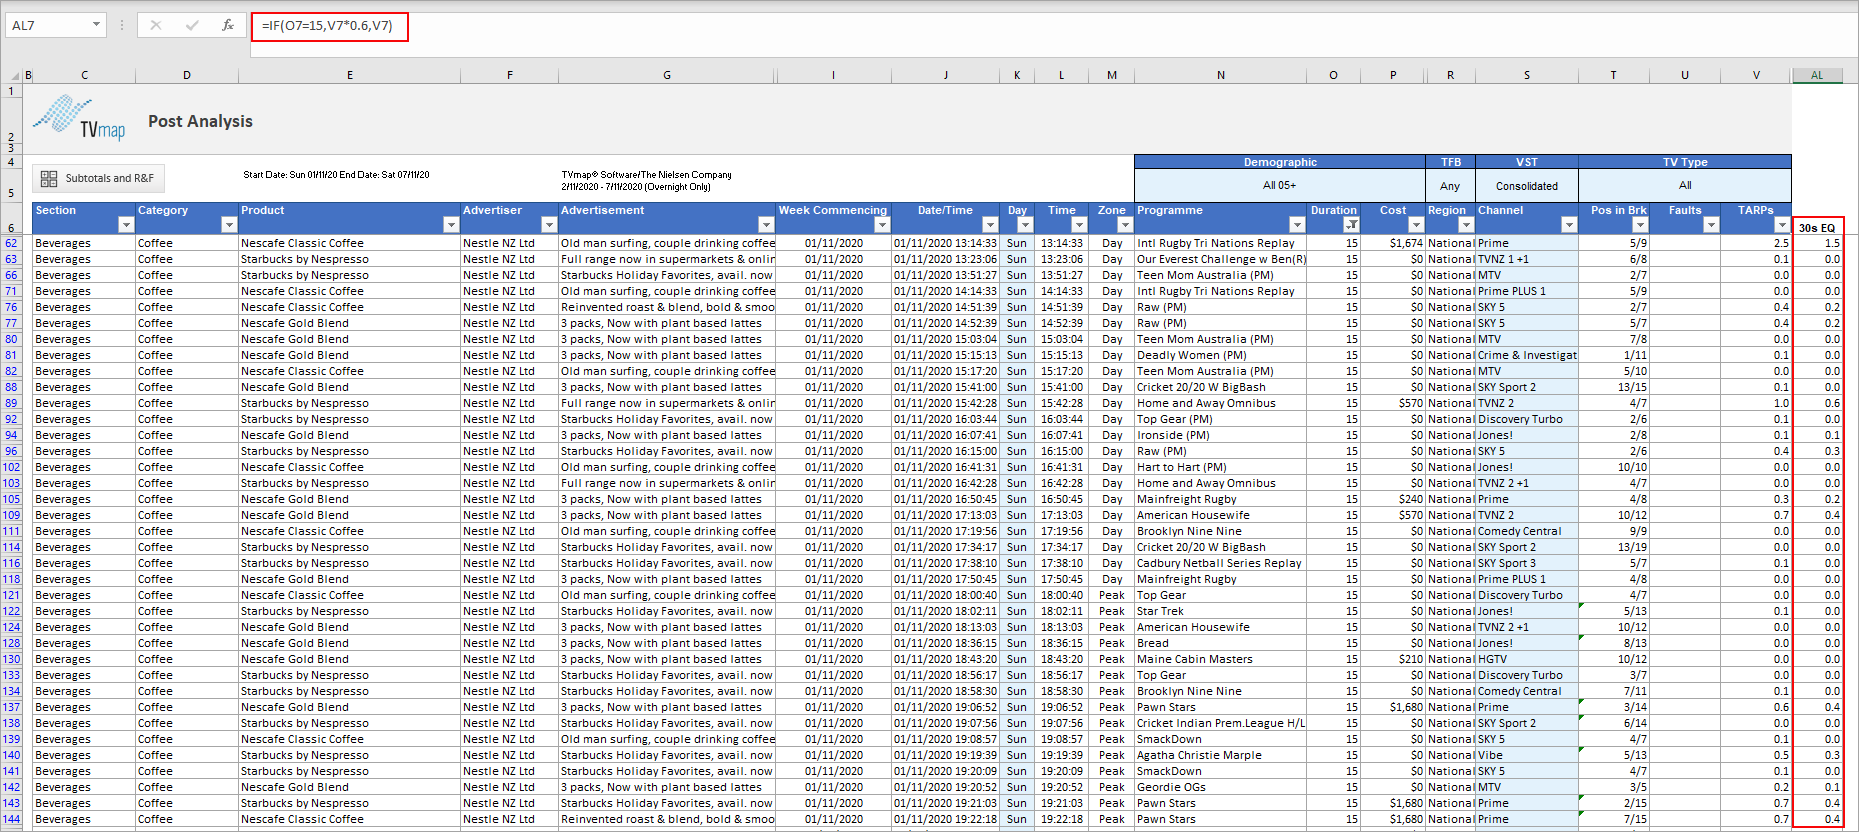
What you are doing is referencing the cell with the duration and if it is 15 seconds the formula will then work out the 30" Equivalent.
(Post Analysis result has been filtered by Duration to show the 30sec equivalent for 15sec spots)
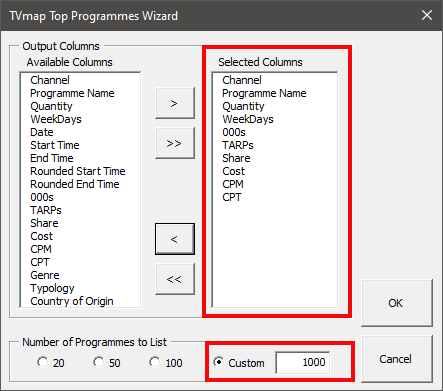
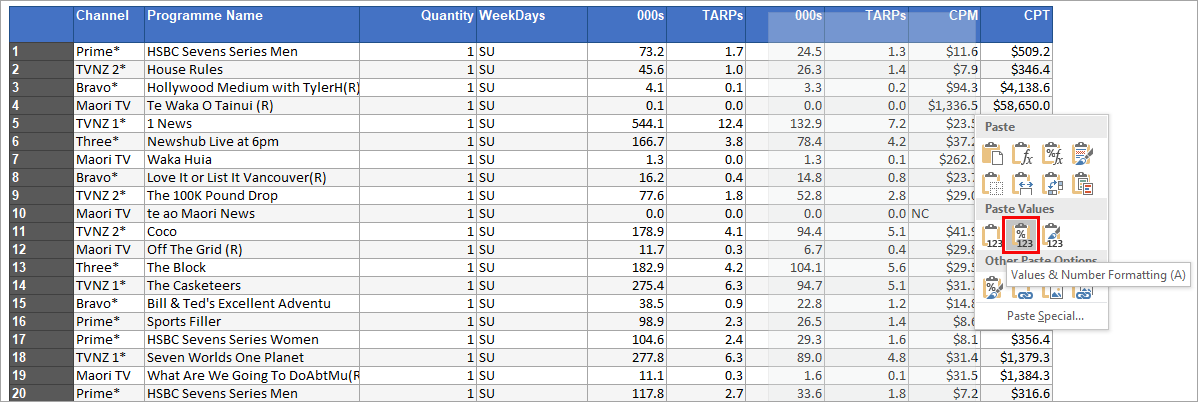
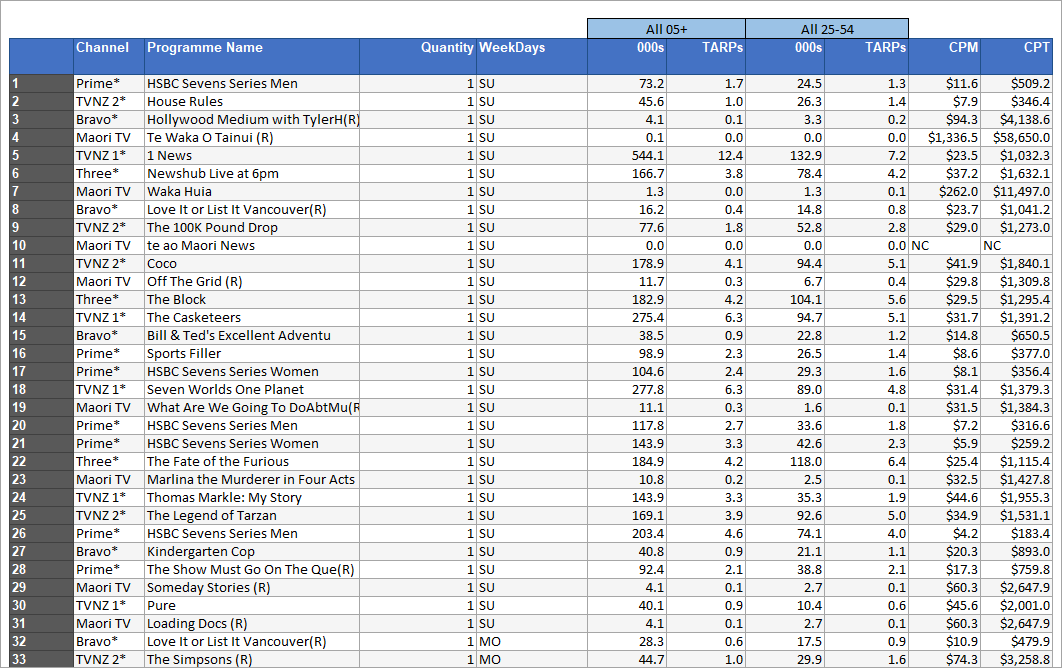
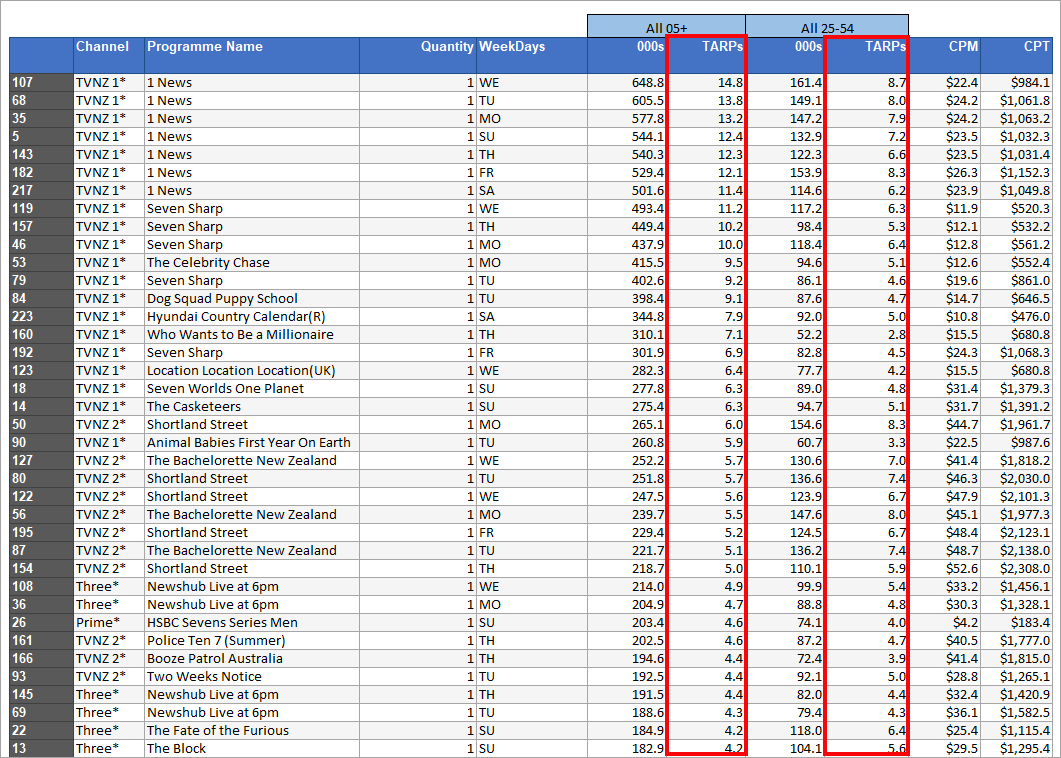
How can I see ratings for two different demographics in Top Programmes?
From the wizard remove unwanted columns and set the Number of Programmes to List to 1000 so you get all the programmes.
Run the Top Programmes for one demo for all times sorted by Date/Name
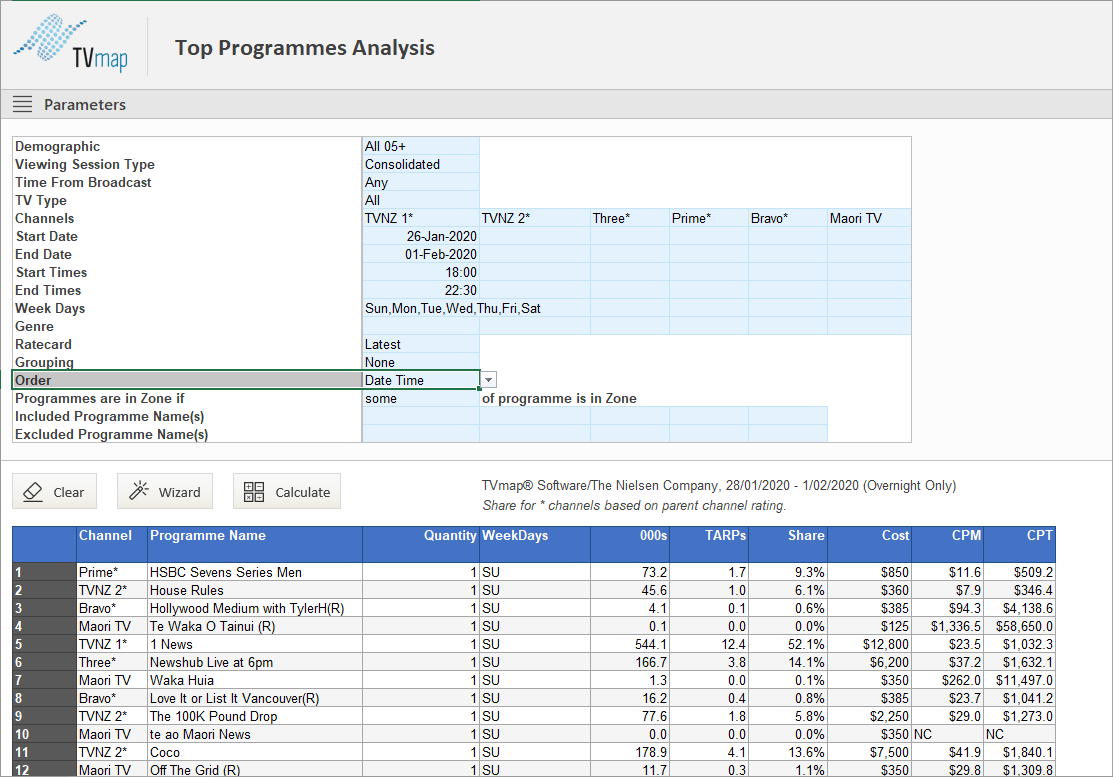
Export results to a static workbook
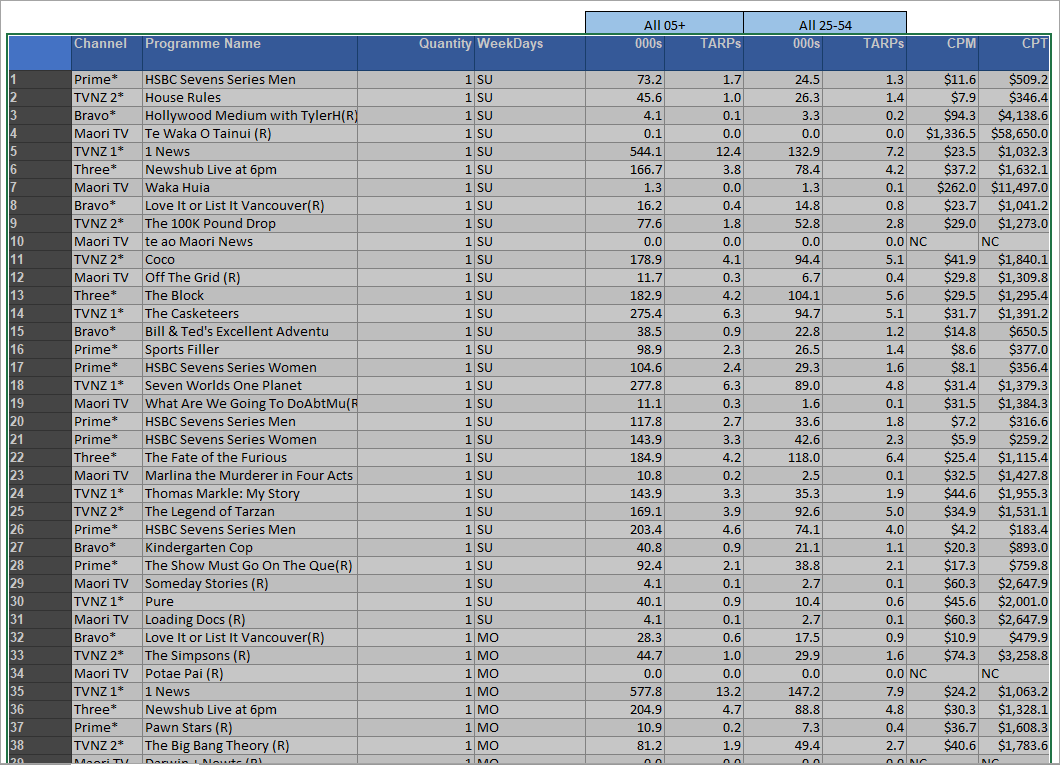
Once it is exported go back to the Top Programmes template and run it for the second demo.
Copy the 000s and TARP columns.
Paste them using paste special with values and number formats into the static sheet to the right of the All 05+ 000s & TARPs columns
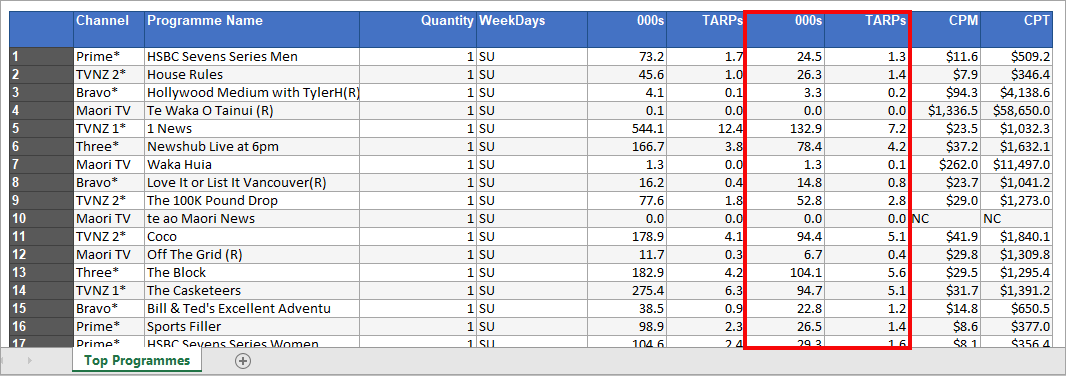
You can then add headers to the columns
The sheet can be sorted to give the ranking with the second demo alongside
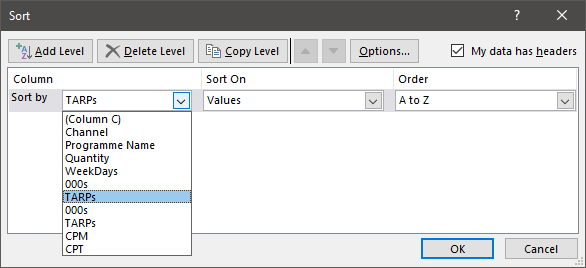
Select all populated cells from the results (exclude any empty cells)
Use the sort function in Excel to add a custom sort. Sort by TARPs for All 05+ (this will be the first TARPs in the list)
Order by Largest to Smallest
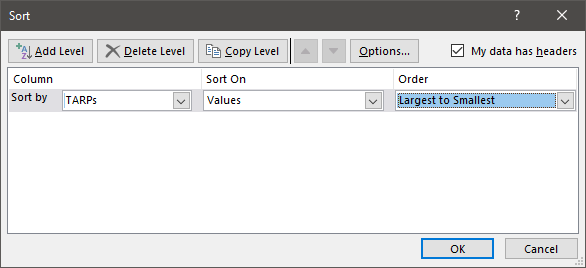
Click OK. Results will now be ranked by TARPs with the second demo alongside.
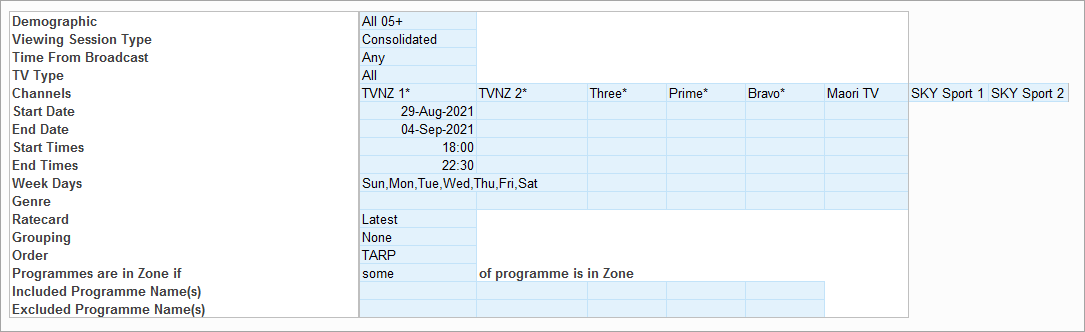
How to add more channels to Top Programmes
Select all channels
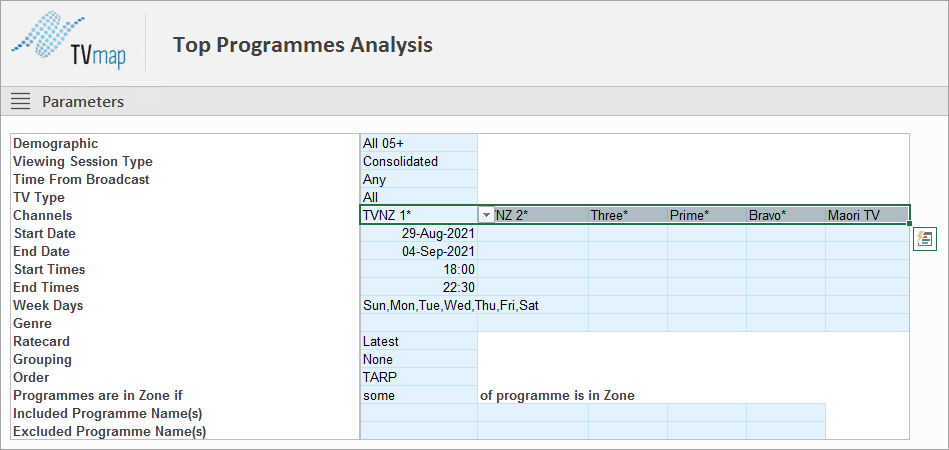
You will see it has a named range of Station
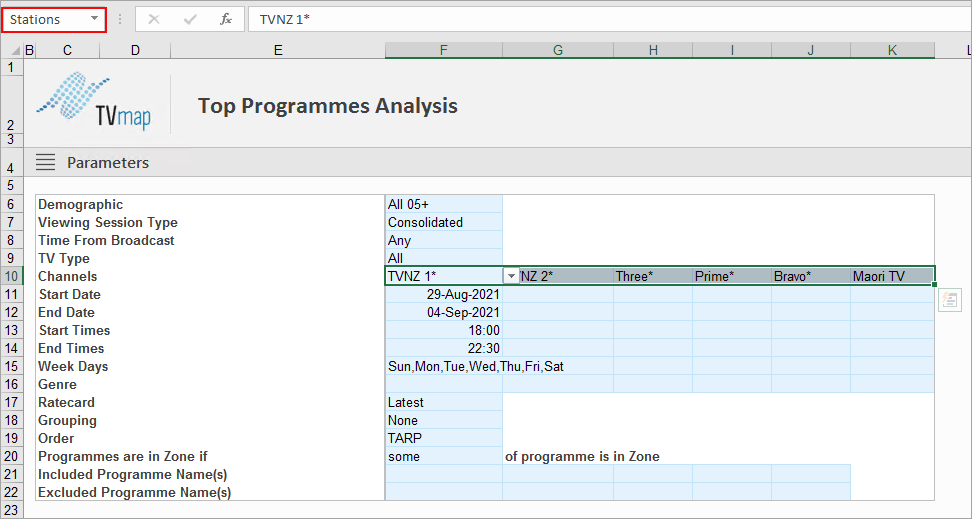
Go to Formulas and click on Name Manager
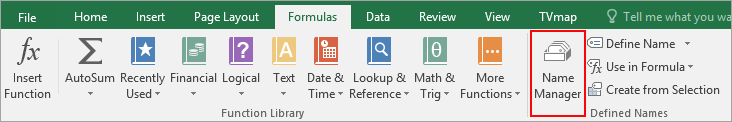
Find the one called Stations
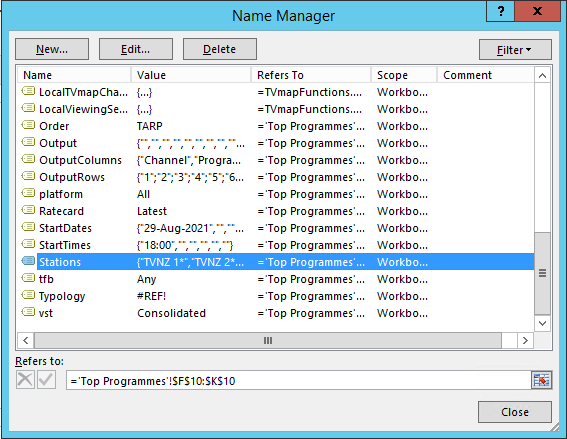
Extend out depending on how many channels you want to add
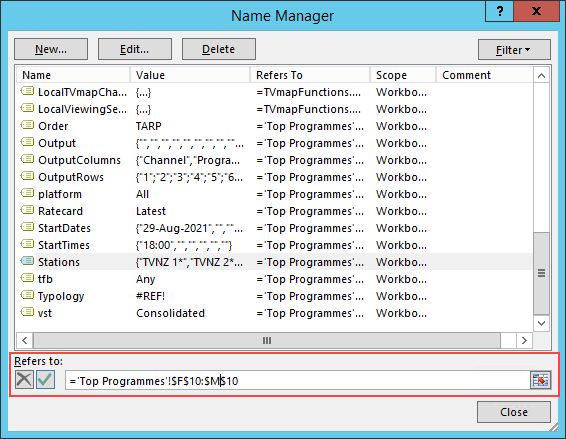
Then copy and paste Channel cells across to insert more
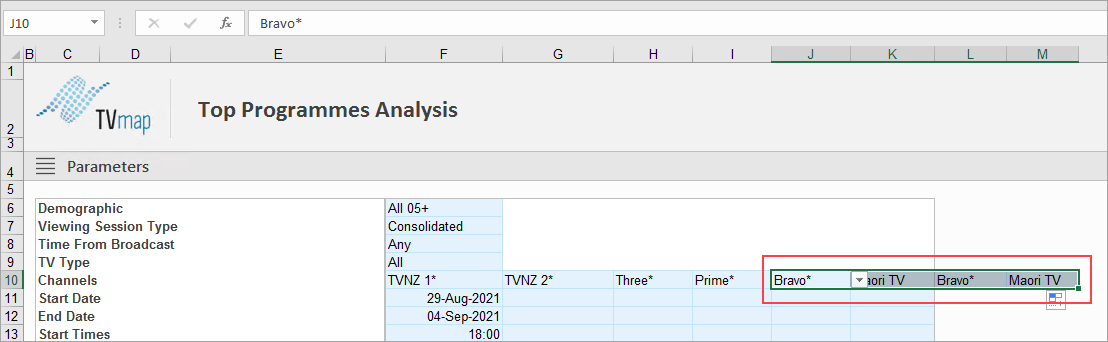
Change to the channels you want to include
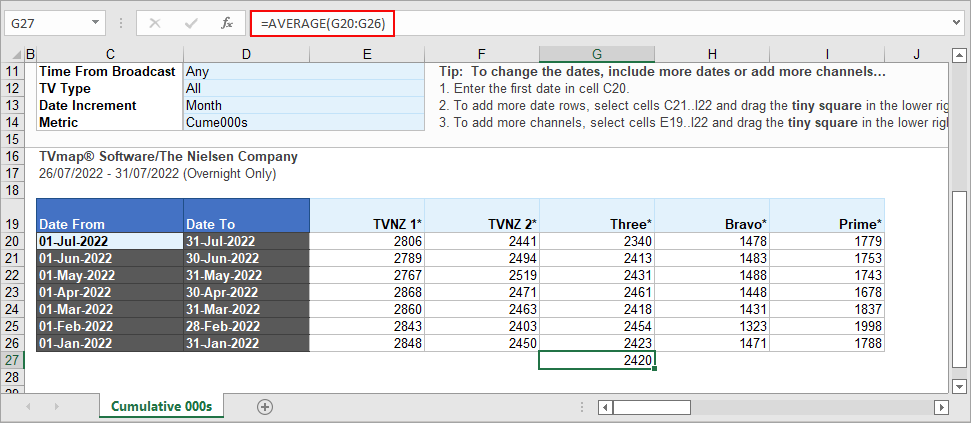
Can Average Cume 000s be Totaled for a Particular Period?
The Cumulative Audience template when run by week or month shows the Cume Audience by that week or month. A viewer is counted once and therefore won't be counted a second time within the selected time period.
Adding six monthly runs together will give an incorrect, inflated result as people who have watched across multiple months will be counted multiple times.
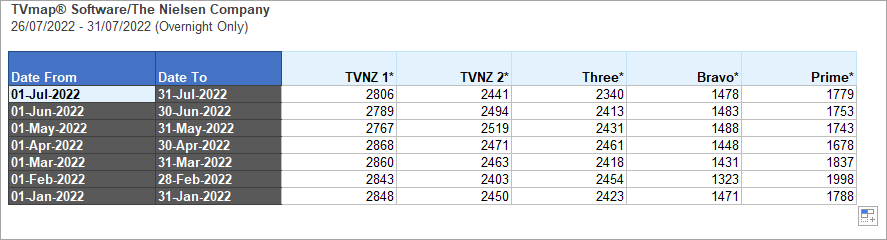
How to get Average Cume Audience Based off 1 Month Averages for a 6 Month Period
Change the Date Increment to Month and enter the start day of the last month in your six month period in cell C20.
eg: 01-May-2020
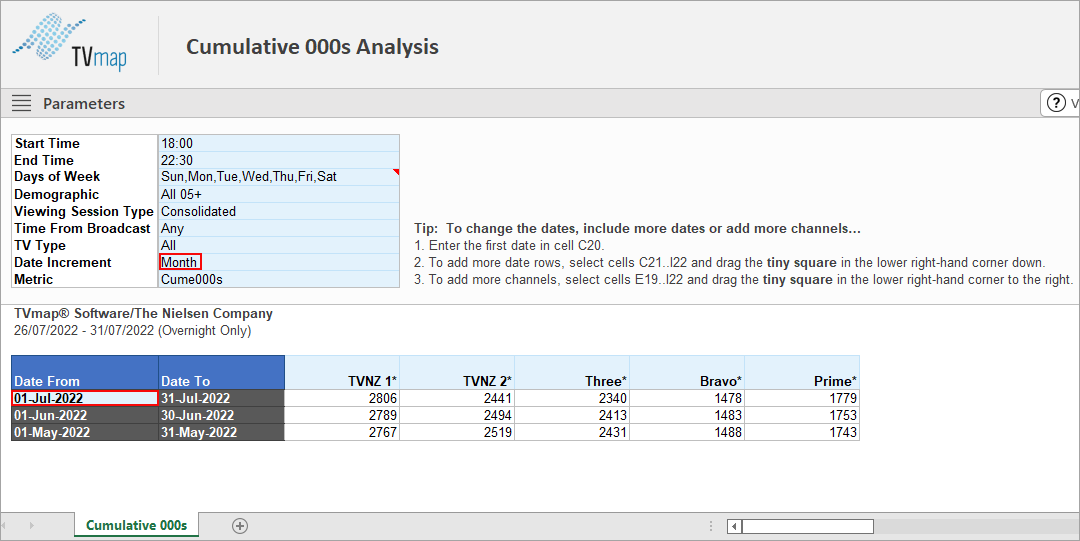
Then highlight the last row in the results and drag it down until you have 6 month listed.
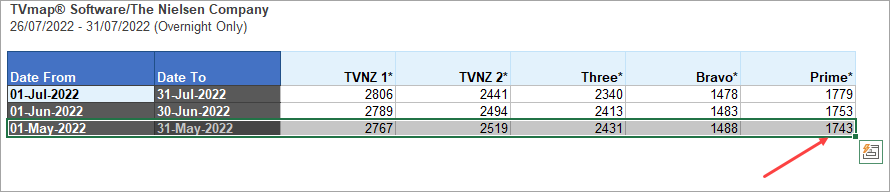
The values will update.
The final step is to get the average of each of these 6 months.
A quick way to do this is to highlight the 6 cells and viewing the results at the bottom of the excel sheet.
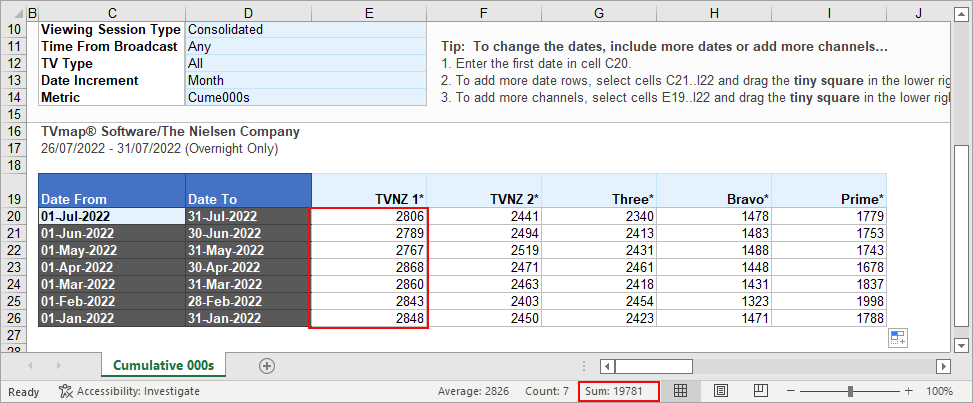
Alternatively you can enter the Average Function into the excel sheet.
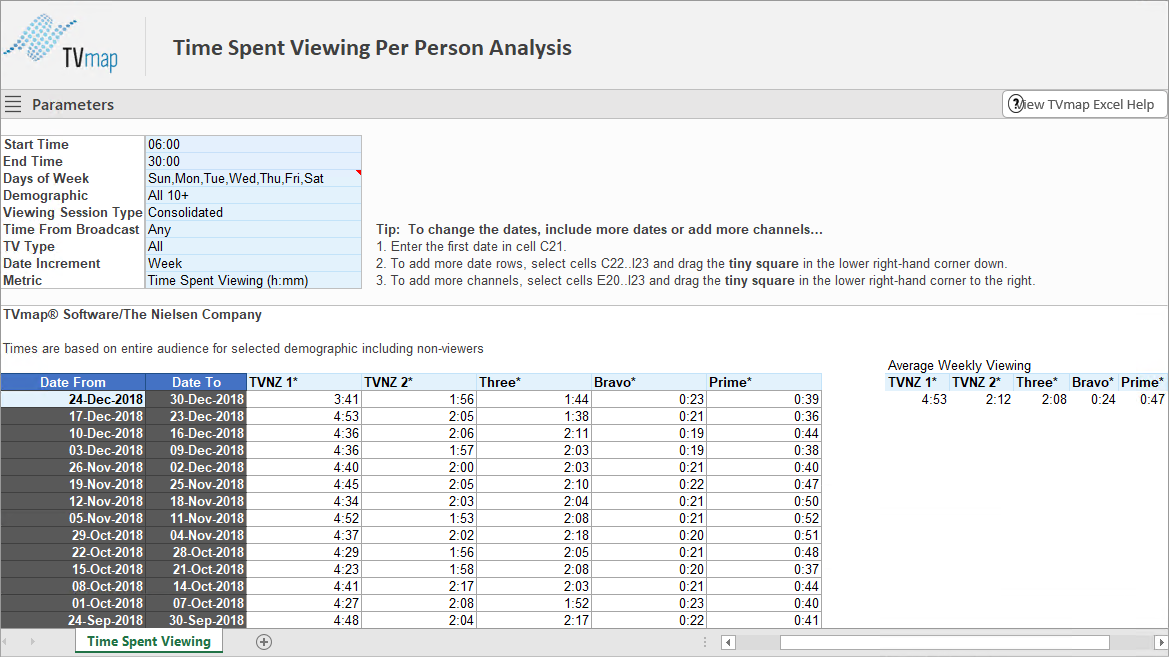
How can I see the average number of TV viewing minutes in a typical week?
This can be achieved by running each week for example all of 2018, then averaging the weekly results like the screenshot below.
To get the overall figure use PUTs as a station. It is possible to set stations as TVNZ Released, Warner Bros. Discovery Released and Sky Network to get a broadcaster breakdown.
Do the averages include people in the selected demographic that don’t watch a particular channel at all?
The TVmap function TimeSpentViewing (that is used in the template of the same name) is calculated by multiplying the TARP by the duration (as a day part). This is the "average person within the demographic, regardless of being a viewer or not" method. We do not support the "actual viewers" method.
For example, if average TARP is 15.5, and you’re looking at 18:00-19:00 over 7 days you get:
Total duration |
= 60 * 7 = 420mins = 0.291 Days
|
TARP / 100 |
= 0.155
|
0.155 * 0.291 |
= 0.0451 days = 1hr, 5 minutes give or take |
What is the minimum time required to register a value in Time Spent Viewing?
The minimum time for a viewing to register is 8 min. Guests are not counted.
The following is from nielsenmedia.co.nz:
TIME SPENT VIEWING or TSV: How many minutes/hours an audience has viewed a particular channel. There are two calculations that can be used that provide significantly different figures. The measurement in dataline (and TVmap) provides the TSV a programme for the average person within the demographic, regardless of being a viewer or not. This calculation is made with ave. aud. and potential. The second calculation provides the TSV for actual viewers and is made using ave aud and cumulative audience.
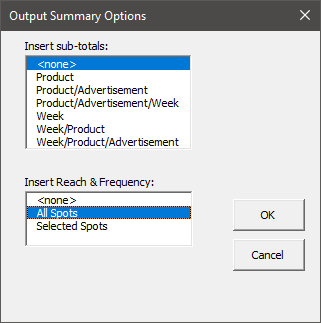
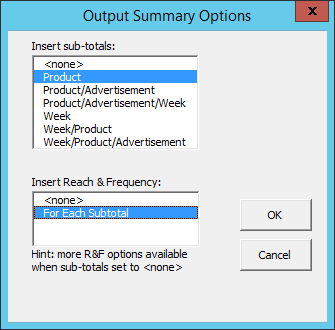
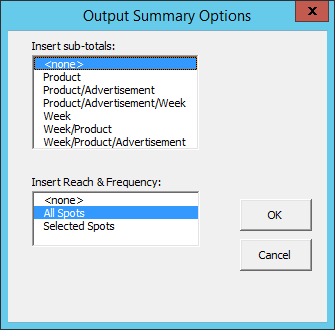
How can I run a total R&F for multiple Key Numbers in Post Analysis?
From the Spots tab click Subtotals and R&F and run using the below parameters:
Use the filtering option to filter by Key Number- make sure to include (Blanks).
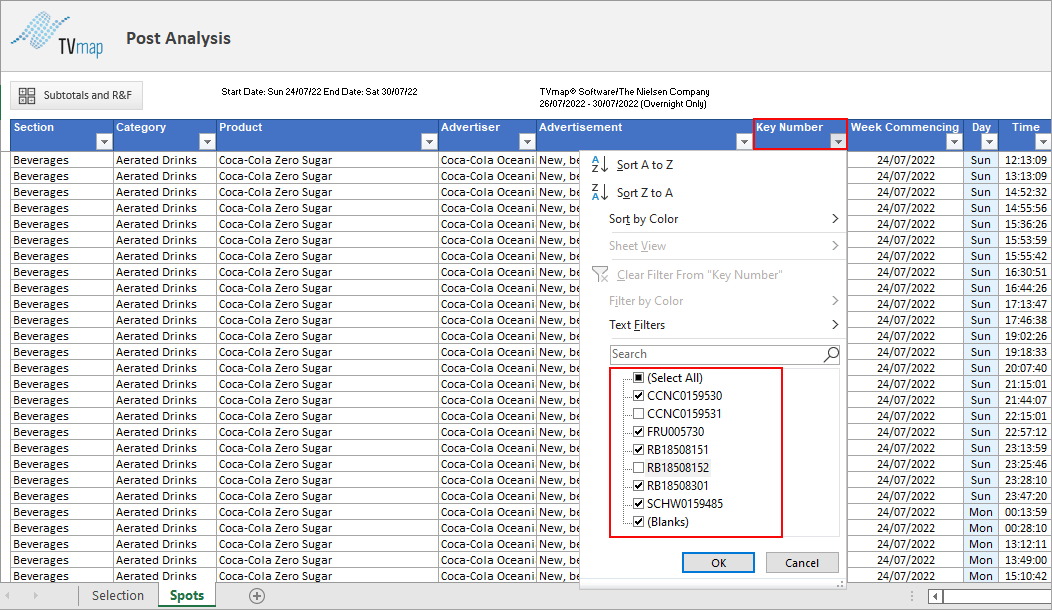
The R&F will show for the filtered spots.
To look at R&F for two Keys Numbers across two different products ran the R&F for all spots then filter by Key Number.
* Excel® is a registered trademark of Microsoft Corporation
Have more questions? E-mail us: support@broadcastmap.co.nz or call us: +64 9 304 0762
|
|
©2026 Broadcast M.A.P. Limited. All Rights Reserved.
|