Provides the functionality to assess the performance of spots in relation to cost versus other spots in the schedule.
Analysing spots
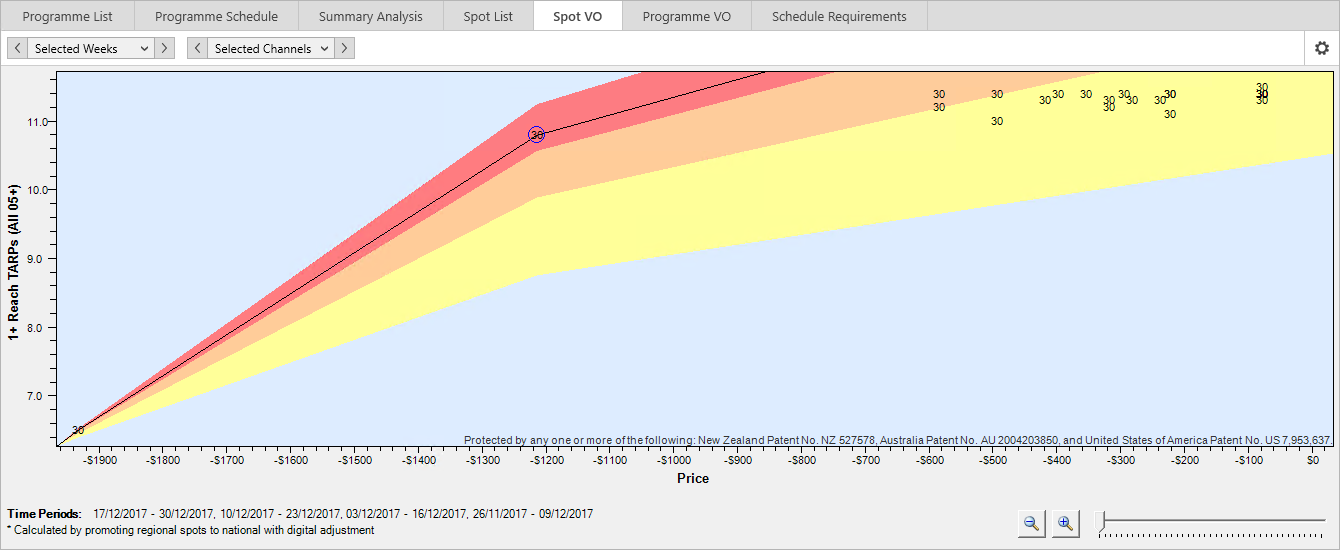
Each booked spot is represented as a number on the display. The number is equal to the duration of the booked spot e.g. if a 30 second spot has been booked in a programme it is shown as 30. Spots can also be identified by selecting the spots in the Spot List tab and the selected spots will be highlighted in the Spot VO. To view details of a spot, place the mouse on the Spot Length.
Spots are plotted on the graph based on their contribution to the reach and the cost of the spot. Spots inside the red area have a lower incremental reach contribution and higher cost and should be considered first for deletion.
Spots with a relatively high contribution to the reach and low cost sit outside the red highlighted area.
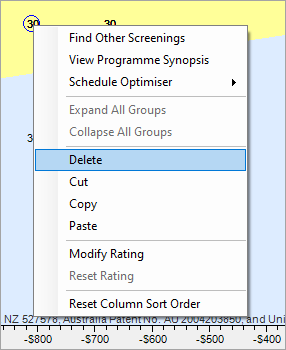
To delete a spot from this screen, right click the spot and select Delete. Any time a spot is deleted, the graph will recalculate based on the remaining spots.
Reach and Frequency Graph Options
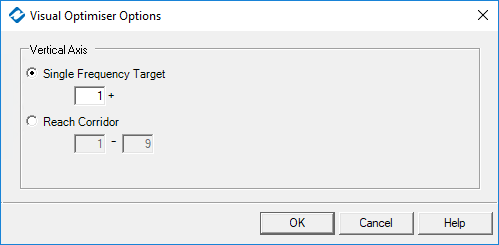
To access the Reach and Frequency options click the![]() icon.
icon.
Single Frequency Target - this level can be changed on the vertical axis e.g. for 2+ objective enter 2 into the Single Frequency Target box.
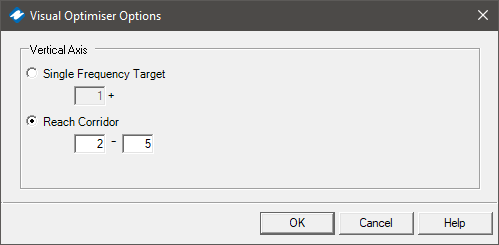
Reach Corridor - for a reach corridor objective, click on the Reach Corridor (which disables the Single Frequency Target); enter the required reach corridor.
Zoom In or Out - zoom in or out on the spots using the scroll bar or by clicking on the magnify buttons.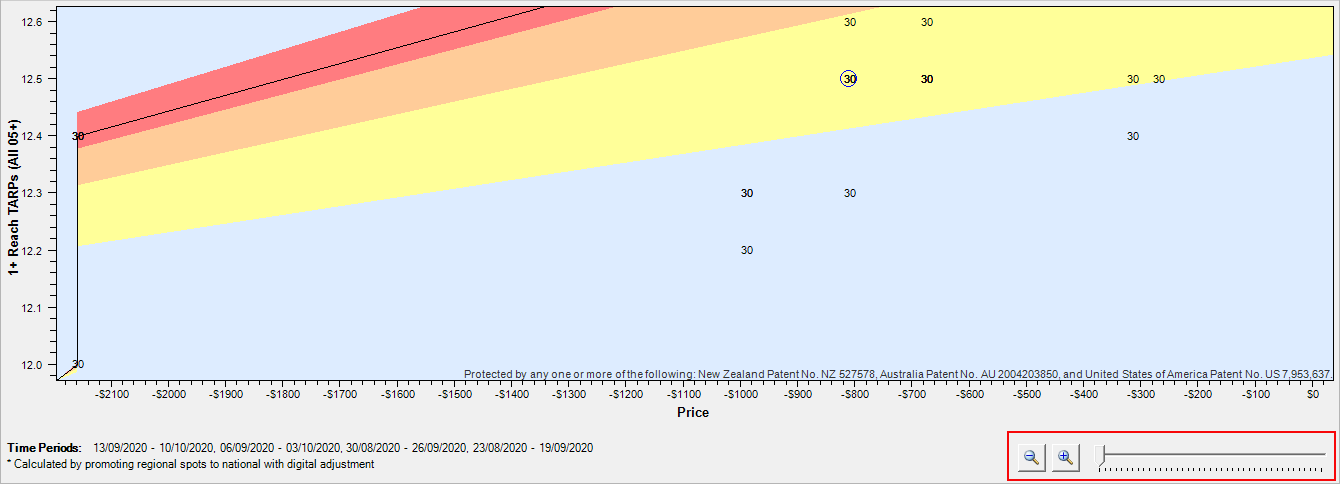
Have more questions? E-mail us: support@broadcastmap.co.nz or call us: +64 9 304 0762
|
|
©2026 Broadcast M.A.P. Limited. All Rights Reserved.
|