Campaign Toolbar
Shortcut icons are available along the top toolbar in TVmap.

A brief description of each icon is displayed when the mouse is hovered over the top.
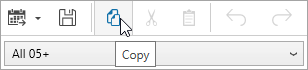
Save and Copy shortcuts are available by selecting the appropriate icon on the toolbar.
![]()
Reports - view/print reports based on any spots booked in the Spot List tab. This icon is only available from the Spot List, Summary Analysis tabs.

Export to Excel* - exports the information onscreen to a Microsoft Excel spreadsheet. The export reflects the current grouping and filters applied.
Options available are:
▪Export Grid to Excel
▪Export Selection to Excel
▪Export to Pivot Table
▪Link Spot Schedule to Excel Pivot
These options will change dependent on the selections made onscreen.
![]()
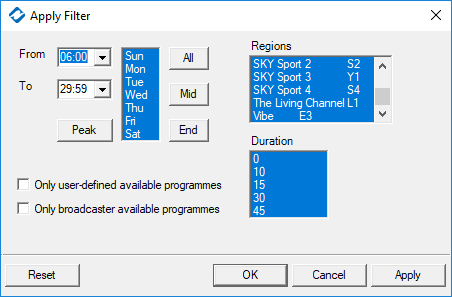
Filter - results can be filtered by Time, Day, Regions or Durations. Filters are content specific and may have different options depending on the tab selected.
![]()
Reach and Frequency - once spots have been booked Reach and Frequency can be run.
![]()
Quarter Hour View - displays the selected programme information in relation to surrounding programmes and stations. Can also be selected by right clicking a programme.
![]()
| Find Other Screenings - brings up all other screenings in Programme Search for a selected programme. |
![]()
Demographic - select from the drop down of available demographics.
![]()
Sample & Potential - displays the Sample and the Potential.
![]()
Nett of Discounts - there are three options available:
▪Nett of Discounts/VID - The published ratecard value including any applicable booking and Volume Incentive Discounts (VID)
▪Nett of Discounts/VID and Commission - Deducting 20% commission from all spots except for TVNZ spots after 1 January 2011 which attract 10% commission
▪Nett of Discounts/VID Grossed to 20% Commission - Taking the Nett of Commission rate and grossing this up to deliver a required commission rate of 20%
![]()
VST - Viewing Session Type. Consolidated and Overnight can be selected from the drop down.
![]()
Campaign Tasks
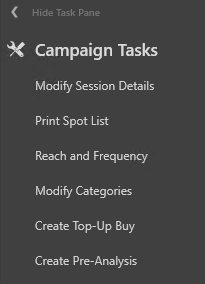
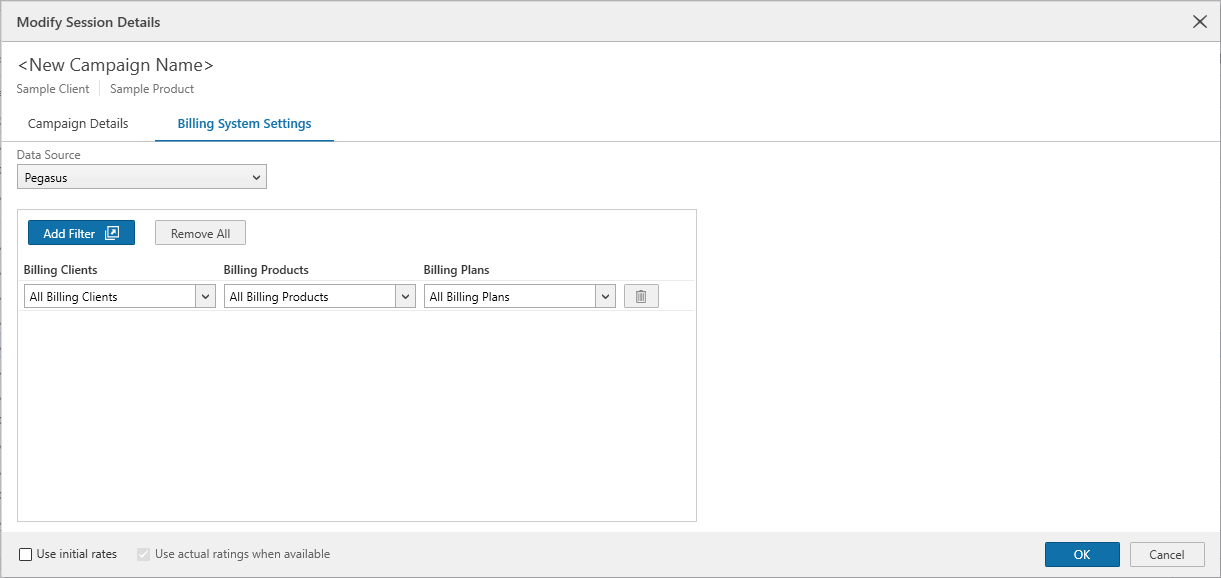
Modify Session Details - This will show a screen similar to the Create Campaign screen allowing modification to the current campaign.
Campaign and Source weeks can be changed along with the demographic and reach and frequency options.
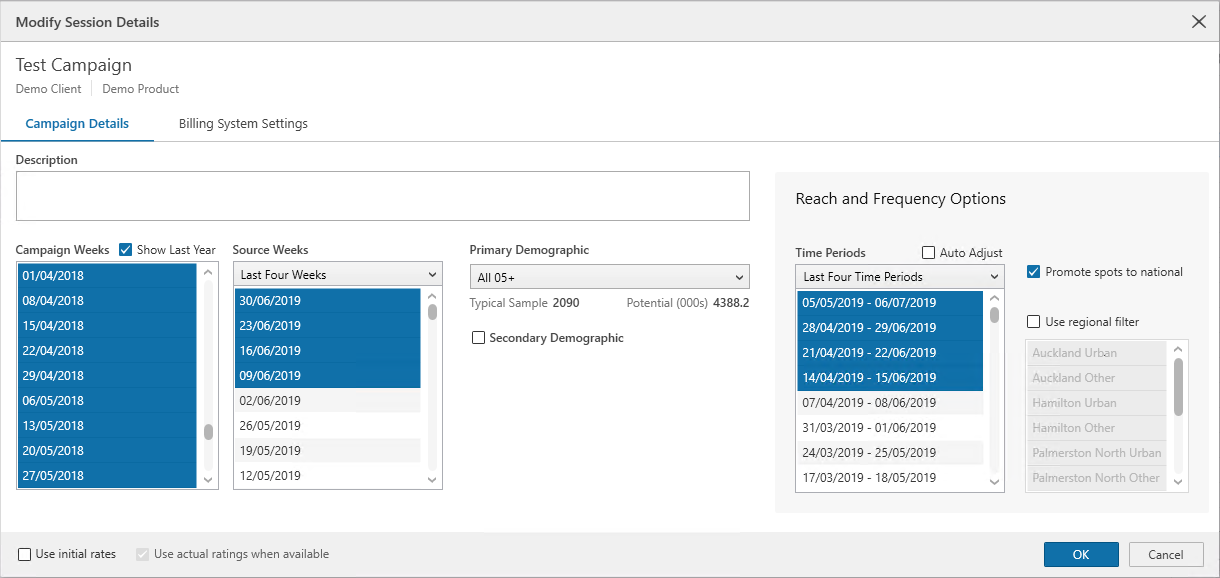
Billing System Settings can be used to add or remove Clients, Products and Plans.
Print Spot List - select to Print or Export the current session - when in the Summary Analysis tab this becomes Print Booking Summary.
Reach and Frequency - will open the Reach and Frequency window. Further information on this is found within the Buying Module.
Modify Categories - Programmes can be assigned a Category. Categories that are set can then be used within the Campaign Requirements and other tabs
Create Top-Up Buy - Opens a new buy with spots from the current campaign under spot list. Create a top-up buy from here.
Create Pre/Post Analysis - Opens a new Pre Analysis based on the current campaign settings.
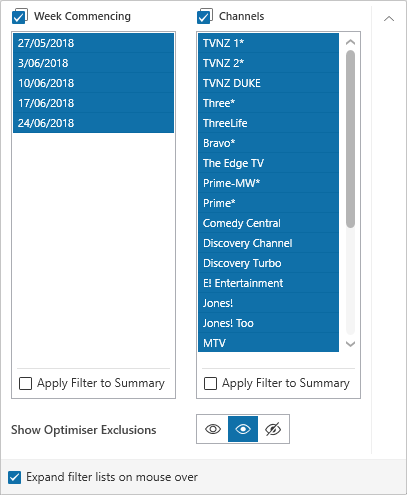
Campaign Filters
These provide the capability to filter the buy by Week Commencing and Channel(s)
All filters are set to show all as default
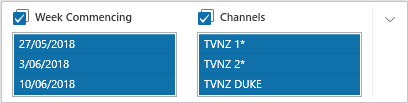
The expand icon ![]() can be used to extend the window to change filter options
can be used to extend the window to change filter options
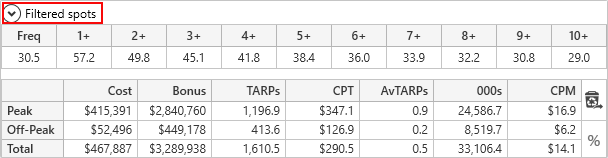
Cumulative Frequency Distribution
This shows a summary of Cumulative Frequency Distribution (CFD) for the campaign
![]()
Campaign Accumulator
Gives a summary of Cost, Bonus, TARPs, CPT, AvTARPs, 000s and CPM for the campaign, split by Peak and Off-Peak for the primary demographic
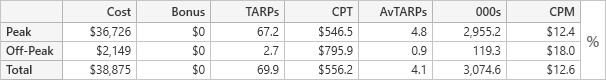
Quickly see Filtered Spots (totals will exclude filtered or hidden spots) or All Spots (totals will include filtered and hidden spots) by changing the drop down option.
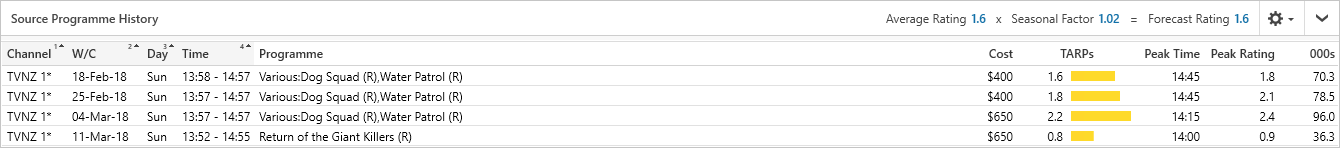
Source Programme History graph and Table
After a programme is selected from either the Spot List, Programme List or Programme Schedule, the graph will show the ratings history for the source weeks selected.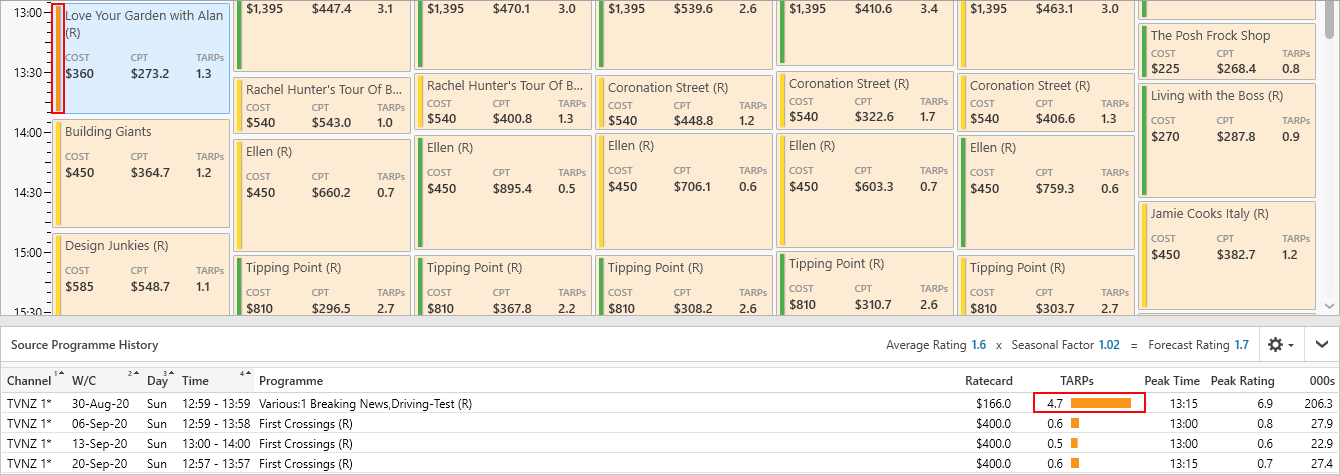
To highlight source week variation, the rating column is coloured to indicate the level of variation.
•Green = low variation
•Yellow = moderate variation
•Orange = high variation
If the source programme information shows large variations or special event programmes you can override the ratings by double clicking on the ratings in the spot detail pane to enter an estimated rating.
At the top of the source history TVmap displays the calculation of the predicted rating showing the seasonal factor applied to the programme.
The source programme pane also shows the peak time and rating for the source weeks to help determine the best break time within the programme.
The table can be minimized using the arrow![]() in the right upper corner of the table.
in the right upper corner of the table.
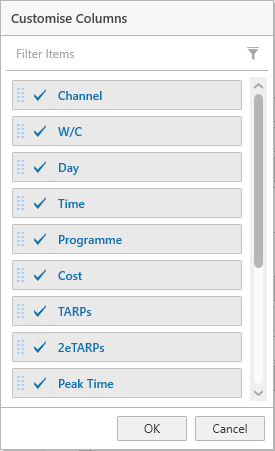
Customise the columns using the ![]() icon.
icon.
Have more questions? E-mail us: support@broadcastmap.co.nz or call us: +64 9 304 0762
|
|
©2026 Broadcast M.A.P. Limited. All Rights Reserved.
|